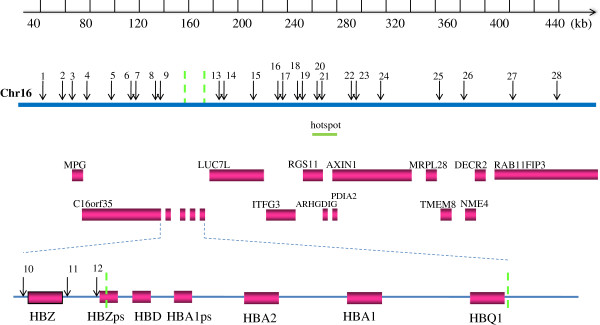
Figure 1.

Map of the 28 SNPs around the --SEA deletion. Genes in the region are shown as boxes. SNPs are represented as arrows with numbers corresponding to Table 1. The dashed lines on chromosome 16 and the magnified view of the α-globin gene cluster indicate the breakpoints of the deletion. HBA2, hemoglobin alpha 2; HBA1, hemoglobin alpha 1; HBZps, hemoglobin zeta pseudogene; HBD, hemoglobin delta; HBA1ps, hemoglobin alpha 1 pseudogene; HBQ1, hemoglobin theta 1.
