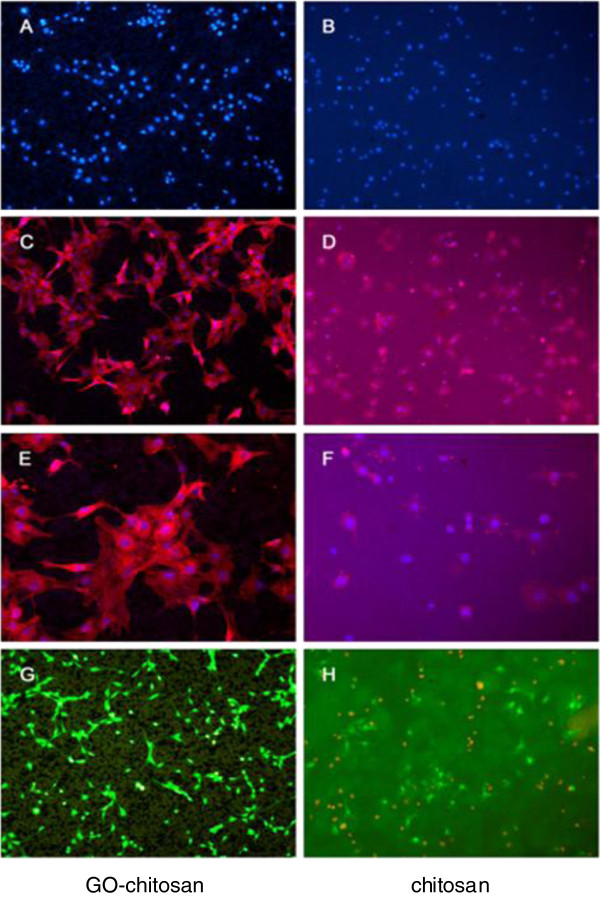
Figure 8.
Cell contrast fluorescence micrographs on GO-chitosan film and chitosan film. Cell phase contrast micrographs onGO-chitosan film (a) and on chitosan film (b) at 24 h. (c) shows the cells adhering on the GO-chitosan film at 24 hunder 5Xobjective. (d) shows the cells adhering on the chitosan film at 24 hunder 5X objective. (e) and (f) are higher zoom of (c) and (d), respectively. In the above morphology of cells, the actin stains with phalloidinin red fluorescence, while nuclei stains with DAPI in blue fluorescence. A cell viability stain on GO-chitosan film (g) and on the chitosan film (h), respectively. The assays kit produces a green fluorescence in live cells while a bright red fluorescence in dead cells.

