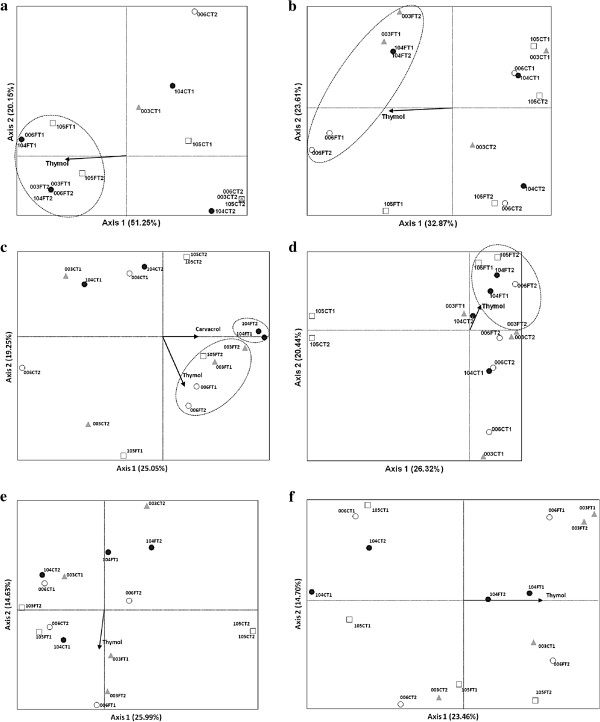
Figure 6.
Principal component analysis (PCA) ordination diagram with stem and leaf samples from Lippia sidoides genotypes LSID003, LSID006, LSID104 and LSID105 and the components of the essential oil (thymol and carvacrol) as variables (arrows): first axis - horizontal, second axis - vertical. The fraction of the total variance accounted for by each axis is indicated in parentheses. The corresponding communities analyzed are as follows: (a) (b) total bacteria, (c) Alphaproteobacteria, (d) Betaproteobacteria, (e) Actinobacteria and (f) fungi. The genotypes are represented by the three first numbers (LSID - 003, 006, 104 and 105), followed by C or F for stem and leaf samples and T1 and T2 corresponding to the replicates.

