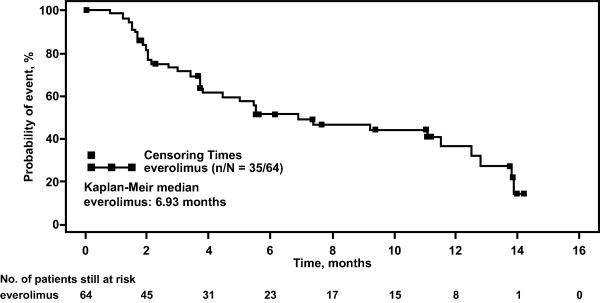
Figure 1.

Kaplan-Meier estimate of progression-free survival. The plot depicts the probability of progression-free survival over time (months) for patients who received everolimus (full analysis set population). The square symbol represents censoring times. The number of patients still at risk is shown for each time point.
