
Figure 1.
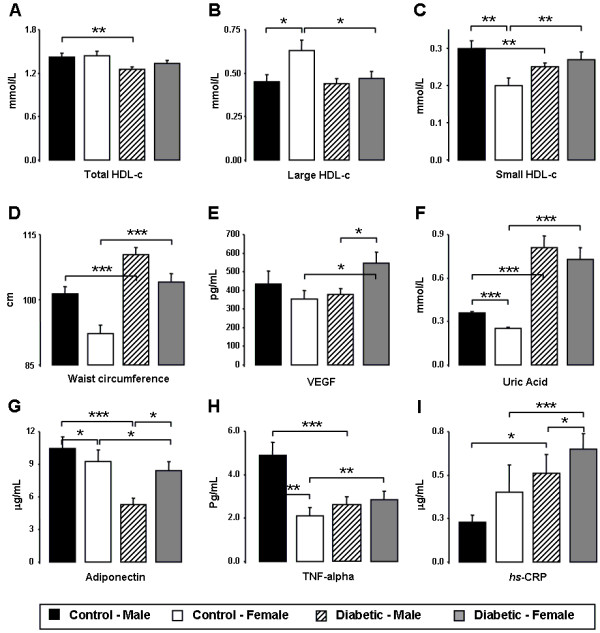
Gender effect on control and diabetic populations. Serum total HDL-c (A), large HDL-c (B), small HDL-c (C), waist circumference (D), VEGF (E), uric acid (F), adiponectin (G), TNF-α (H) and hsCRP (I), in male and female diabetic patients and controls. Results are presented as mean ± SEM. *p<0.05, **p<0.01 and ***p<0.001.