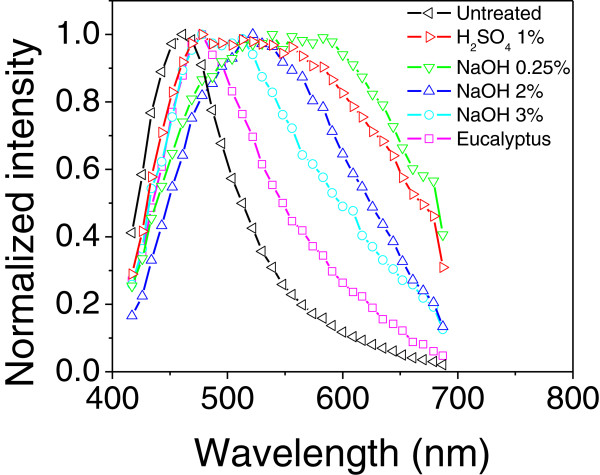
Figure 5.
Fluorescence spectra for two-photon excitation. Dependence of the emission spectra on different treatment processes. Samples were excited by two photons (2P) at 770 nm. The spectra were normalized at the spectral emission maximum for each sample just for comparison. Some concentrations were omitted in order to better display the behavior for which the displacement of the emission bands were consistent with the alkaline deslignification process.

