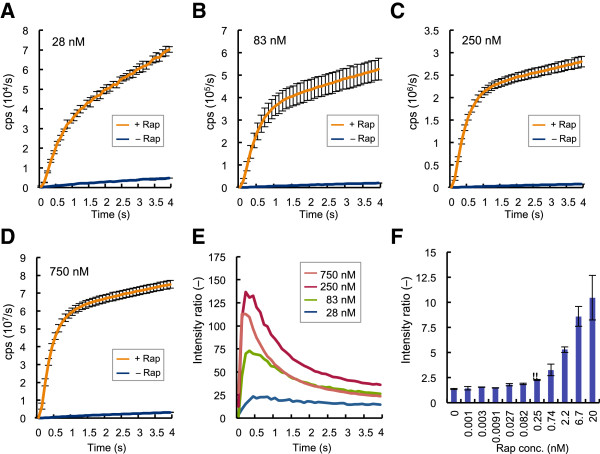
Figure 3.
Concentration dependency of Fluc PCA and sensitivity to rapamycin (A-D) Fluc PCA with FRB/N and FKBP/C with/without equimolar rapamycin at indicated concentrations. Average and SD of three samples are shown. (E) Concentration dependency of signal/background ratio. (F) Rapamycin dose–response using 50 nM each probes. ** : Limit of detection showing higher signal-1SD than the background signal +2SD.

