
Fig. 3.
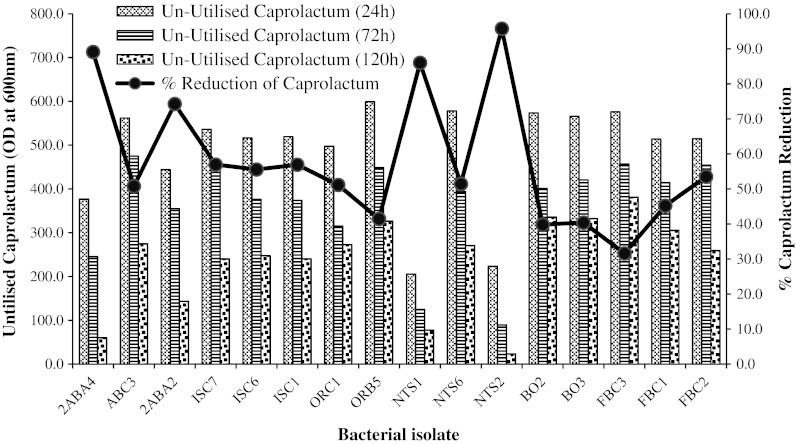
Percentage utilised caprolactam concentration by sixteen bacterial isolates after 120 h. Bar graph shows HPLC readings (OD at 600 nm) taken at the time intervals of 24, 48 and 120 h of un-utilised ε-caprolactam in the medium
Official websites use .gov
A
.gov website belongs to an official
government organization in the United States.
Secure .gov websites use HTTPS
A lock (
) or https:// means you've safely
connected to the .gov website. Share sensitive
information only on official, secure websites.
Percentage utilised caprolactam concentration by sixteen bacterial isolates after 120 h. Bar graph shows HPLC readings (OD at 600 nm) taken at the time intervals of 24, 48 and 120 h of un-utilised ε-caprolactam in the medium