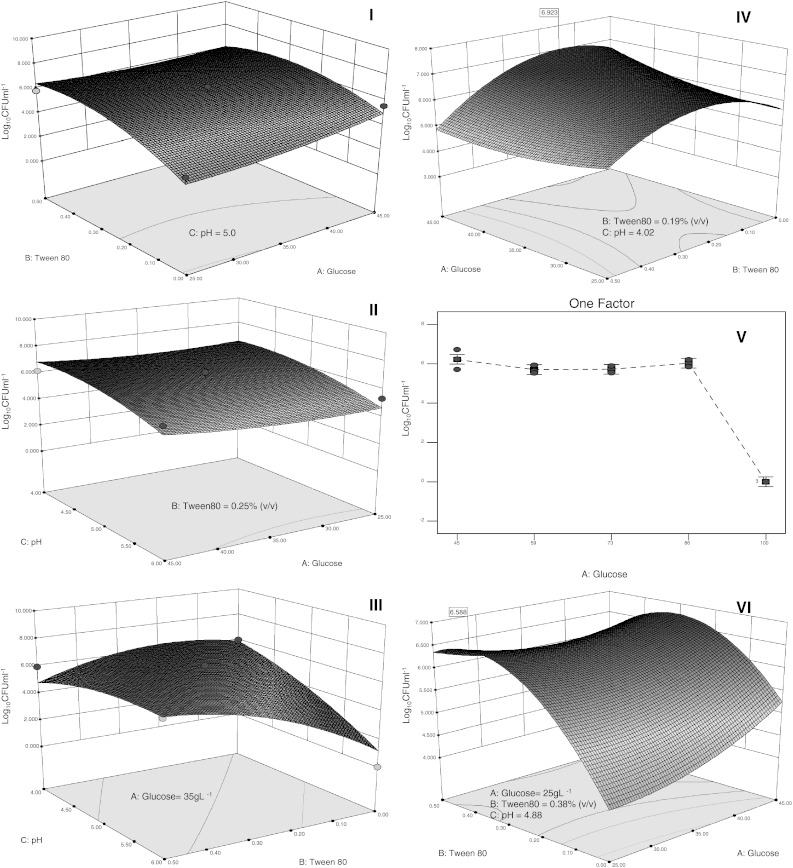
Fig. 3.

Response surface methodology (RSM), (I–VI) and Factorial Design (V). Box-Behnken showing the effects of: I Glucose-Tween 80; II Glucose-pH and III pH-Tween 80 on Log10 CFUml−1. IV In range optimization of glucose, Tween 80 and pH. V One Factor Design effect of Glucose on Log10 CFU ml−1 maintaining the range optimization of Tween 80 and pH. VI Box-Behnken optimization minimizing the glucose concentration and maintaining Tween 80 and pH within the established range
