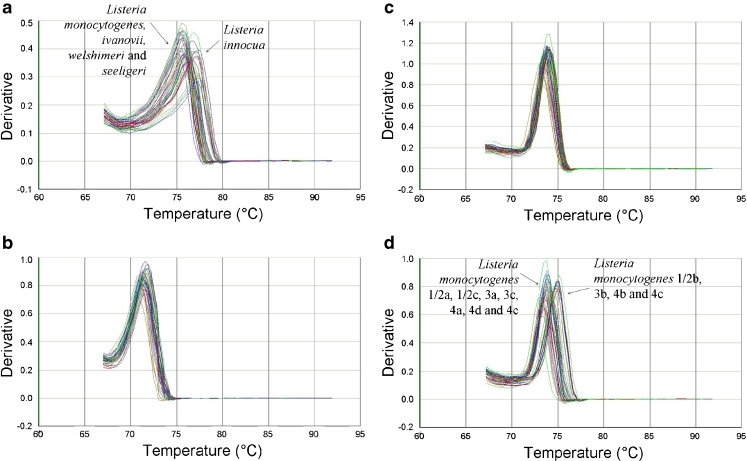
Fig. 1.
Melting curves obtained by SYBR®Green qPCR analysis of the positive pure strains listed in Table 1. The different qPCR assays are iap-50-deg (a), prs-2-deg (b), hlyA-177 (c) and hlyA-146-deg-tronc (d). The temperature is plotted on the X-axis versus the inverse of the first derivate of the best-fitted curve of the measured fluorescence decrease on the Y-axis

