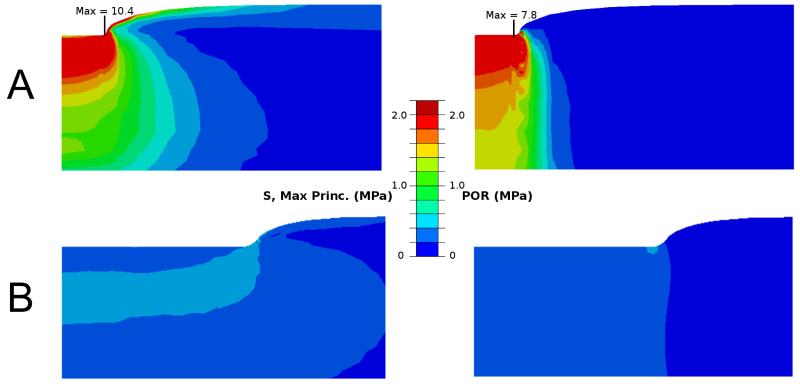
Figure 5.
Maximum principal stress (left) and pore pressure (right) distributions in two cartilage samples. Mankin scores of the samples were (A) 2.4 and (B) 8.6. The distributions were analyzed from the beginning of the fourth or last stress-relaxation period. For clarity, the figures have different size scales.

