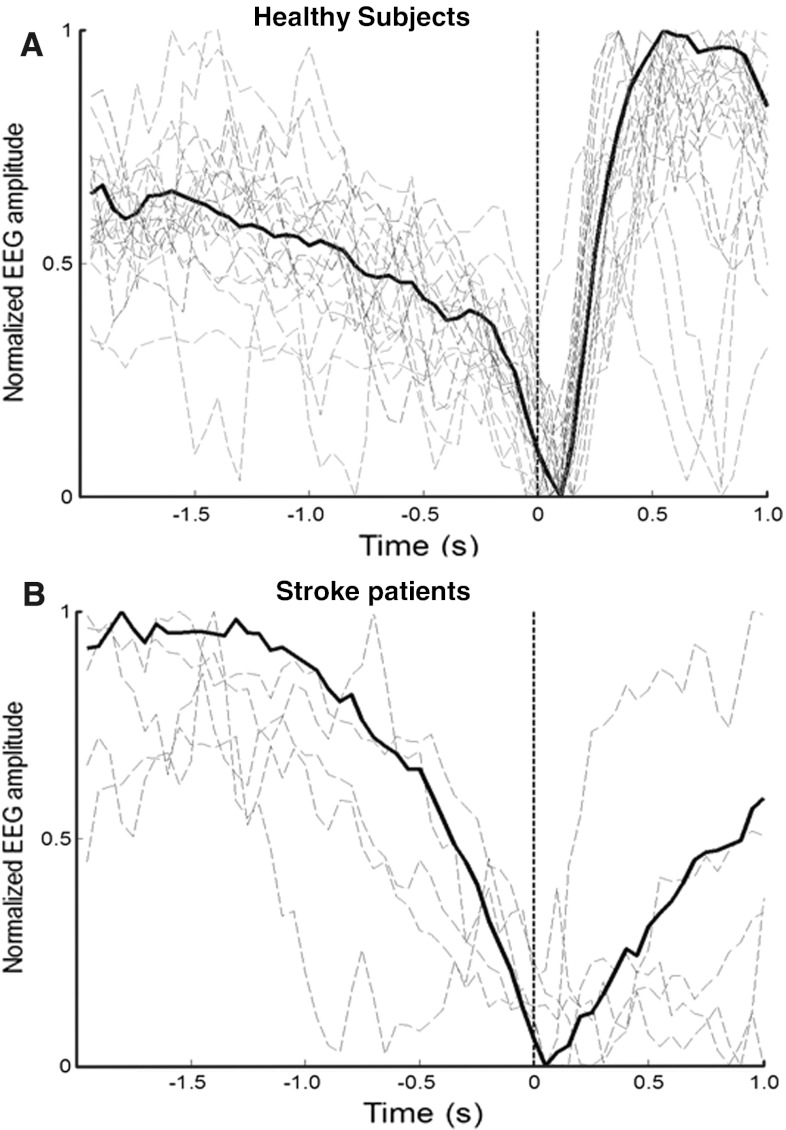
Fig. 1.
Normalized individual and global MRCP. MRCP obtained with OSF for healthy and stroke subjects. The solid line shows the average across all subjects. The dashed lines show the individual MRCPs. The initial negative phase of the MRCP (part before the vertical dashed line) was used as template for the matched filter

