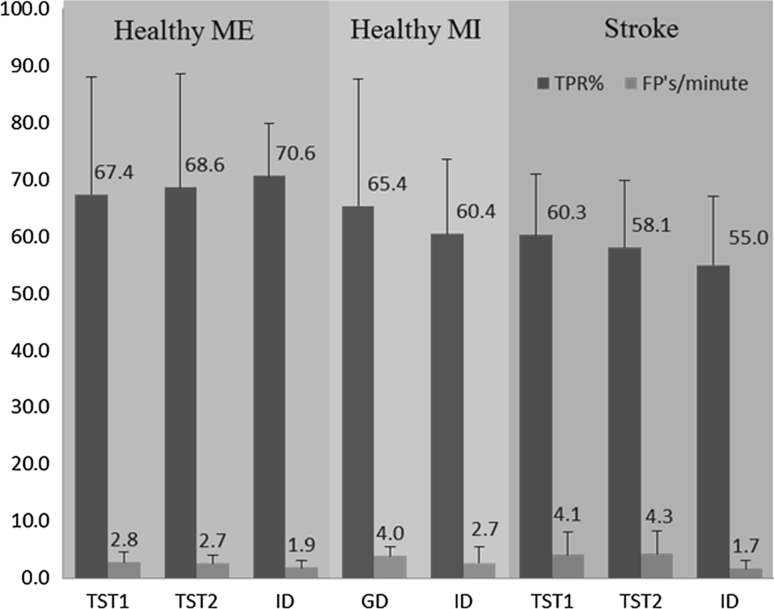
Fig. 2.
Performance for healthy and stroke subjects. Results from healthy motor execution (ME) and motor imagination (MI) (N = 20) and stroke patients (N = 5) testing data set with the TPR (%) (mean ± SD) and FPs per minute (mean ± SD). TST1 represents all the runs of the subject being tested with global detector (GD), TST2 are the identical testing run(s) as used for testing of the ID in motor execution/attempted task in healthy and stroke subjects, respectively

