
Figure 2.
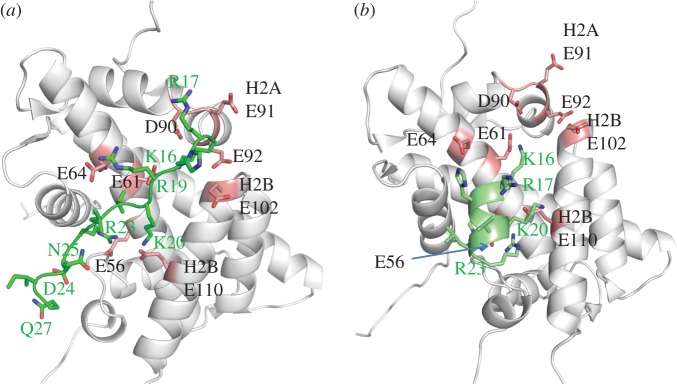
H4 tail domain–acidic patch interactions. (a) Close-up view of the H4 tail–acidic patch interaction observed in the crystal structure [1]. The H4 tail is shown in lime green. Histones are in grey, with acidic patch residues shaded pink. PDB 1A01. (b) Close-up view of the modelled H4 peptide–acidic patch interaction taken from [22]. The H4 peptide is shown in green. Histones are in grey, with acidic patch residues shaded pink. PDB provided courtesy of Dr G. Arya.