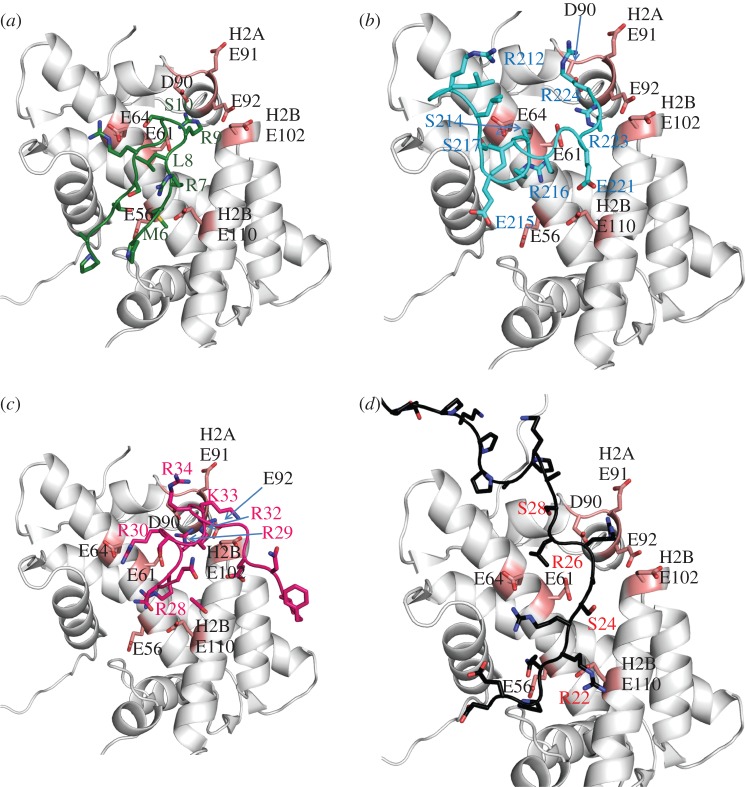
Figure 3.
Nucleosome-binding protein co-structures. (a) Close-up view of the LANA peptide–acidic patch interaction. The LANA peptide is shown in dark green. Histones are in grey, with acidic patch residues shaded pink. PDB 1ZLA. (b) RCC1–acidic patch interaction. RCC1 is shaded in cyan. Histones are in grey, with acidic patch residues shaded pink. PDB 3MVD. (c) Sir3–acidic patch interaction. Sir3 BAH domain is shaded in magenta. Histones are in grey, with acidic patch residues shaded pink. PDB 3TU4. (d) Modelled HMGN2–acidic patch interaction. HMGN2 is shown in black, with key residues labelled in red. Histones are in grey, with acidic patch residues shaded pink. PDB provided courtesy of Dr Y. Bai.

