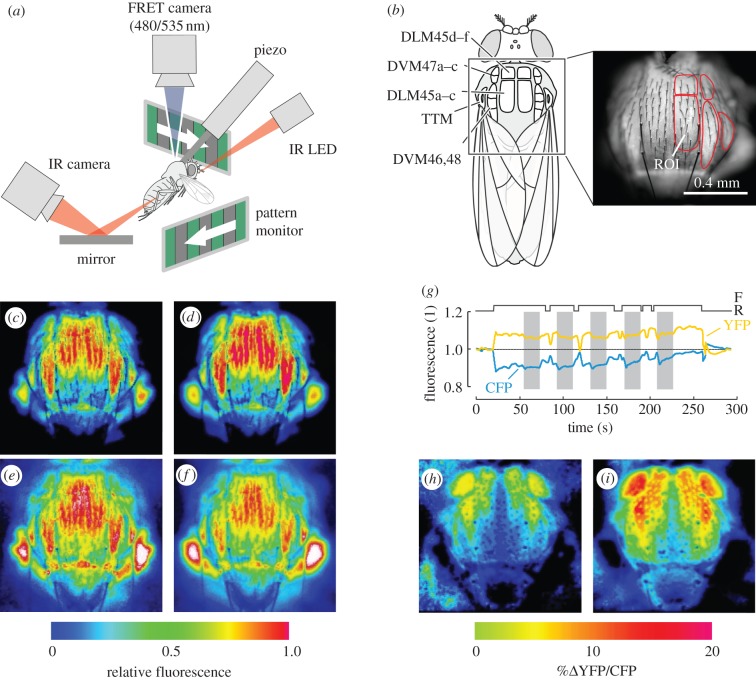
Figure 1.
Methods and FRET imaging. (a) Experimental setup for in-flight calcium imaging of the indirect flight muscle (A-IFM) of transgene Drosophila cameleon 2.1. The fly is tethered to a piezo transducer to monitor stroke frequency, and left and right stroke amplitudes are measured from infrared video images of the flapping wings, illuminated by an infrared light emitting diode (IR LED). The fly is visually stimulated by the motion of two stripe patterns. A fluorescence imaging microscope with 440 nm excitation wavelength records emission wavelengths of 480 and 535 nm while the animal responds to the visual stimulation. (b) Nomenclature for A-IFM adopted from Demerec [48]. Left, muscle attachment sites of the flight muscle on the inner cuticle of the thorax (dorsal view). Right, example of regions-of-interest (ROI) to determine FRET in individual muscle fibres, superimposed with YFP fluorescence image. (c–f) Fluorescence images of YFP (535 nm; c,d) and CFP (480 nm; e,f) during rest (left) and flight (right) plotted in pseudo-colour. For thorax orientation refer to (b). (g) Changes in YFP and CFP fluorescence during flight and rest, and during visual stimulation (grey, optomotor yaw). (h) Relative YFP/CFP ratio (FRET) in a resting and (i) in a flying fly. Data are plotted in pseudo-colour and normalized to mean YFP/CFP ratio during rest. Flight-mediated increase in YFP/CFP ratio is similar to the increase caused by electrical stimulation of the A-IFM (see the electronic supplementary material, figure S3). Images are taken from a 93 s video sequence (see the electronic supplementary material, movie S1). DVM, dorsoventral muscle; DLM, dorso-longitudinal muscle; F, time of flight; R, time of rest; YFP, yellow fluorescence protein; CFP, cyan fluorescence protein.

