
Figure 3.
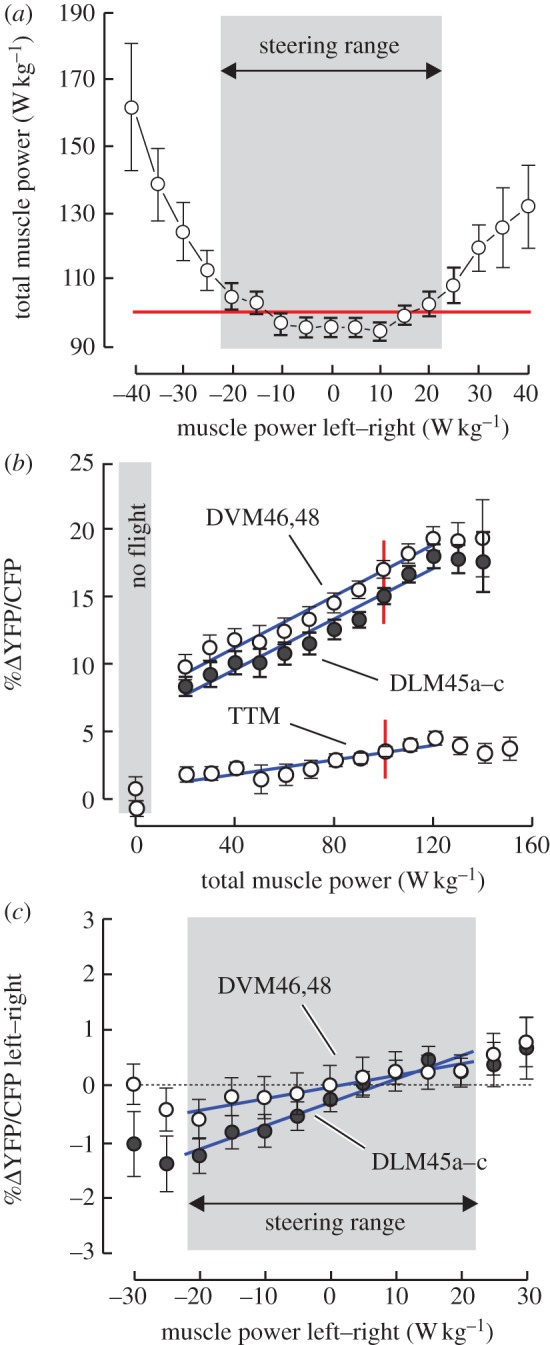
Changes in IFM calcium activation with changing muscle mass-specific mechanical power output during flight. (a) Total A-IFM power requirements during yaw turning behaviour, during which left–right power requirements typically vary between ±20 W kg−1 flight muscle mass. (b) Relative increase of mean (left, right body side) calcium concentration in DVM46,48 fibres and DLM45a–c fibres owing to FRET. Grey area indicates values at rest. Data are binned with a bin size of 10 W muscle mechanical power output per kg A-IFM mass. Number of flight sequences of each mean value from left to right is 7, 12, 18, 23, 24, 25, 25, 25, 22, 22, 20, 18, 11 and 5. (c) Calcium activation in DVM and DLM fibres during optomotor yaw manoeuvres in which the fly increases its stroke amplitude on one side while decreasing it on the other. Difference in YFP/CFP ratio between left and right body side is plotted against asymmetrical changes in muscle mechanical power output (left-minus-right, n = 21 flies). Data are typical of all A-IFM fibres. Grey area indicates typical range of optomotor-induced alteration of mechanical power. Muscle mechanical power that supports the fly's body weight is indicated by the red line in (a). Blue, linear regression fit. For visual clarity, means are presented±s.e.