Figure 2.
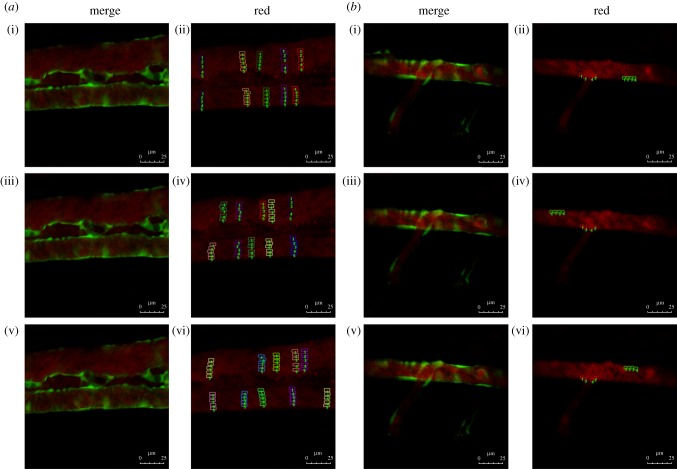
Red fluorescence intensity analysis. Flk1: GFP embryos at 52 h.p.f.; embryos injected with Dil-LDL at 48 h.p.f. (n = 56/60); endothelial cells are green and Dil-LDL is red. (a) Red fluorescence intensity analysis in straight vascular segments. (i,iii,v) Stills from three time points ((i) t = 0, (iii) t = 2.22 and (v) t = 8.88 s) in electronic supplementary material, movie S1. (ii,iv,vi) Fluorescence intensity analysis chart; the small lattice marks the sample taken at the three time points. (b) Red fluorescence intensity analysis of the vascular bifurcation region. (i,iii,v) Stills from three time points ((i) t = 1.674, (iii) t = 2.511 and (v) t = 13.671 s) in electronic supplementary material, movie S3. (ii,iv,vi) Fluorescence intensity analysis chart; the small lattice marks the sample taken at the three time points.

