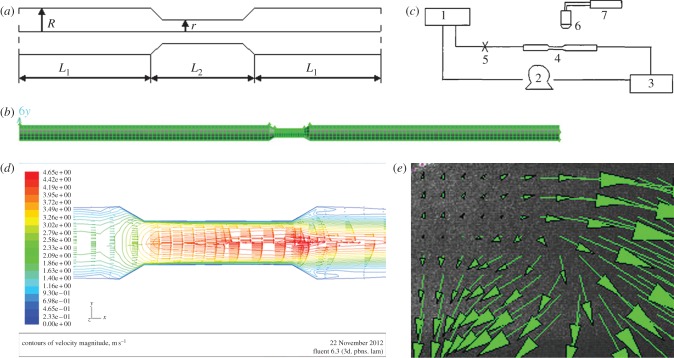
Figure 3.
Analysis of flow field in the vascular stenosis region. (a) Schematic showing the geometric model of local stenosis arteries. The stenosis vessel segment is an axisymmetric tube. r (0.075 cm) is the diameter of the stenosis blood vessel section, R (0.125 cm) is the diameter of the straight blood vessel sections. (R−r)/R represents the degree of stenosis (40%), L2 (0.8 cm) and L1 (5 cm) represent lengths of the different sections. (b) Three-dimensional model of a stenotic blood vessel and mesh dividing. (c) Schematic illustrating the PIV system. (d,e) Distribution of flow field in the vascular stenosis region determined via (d) simulation and (e) PIV determination.

