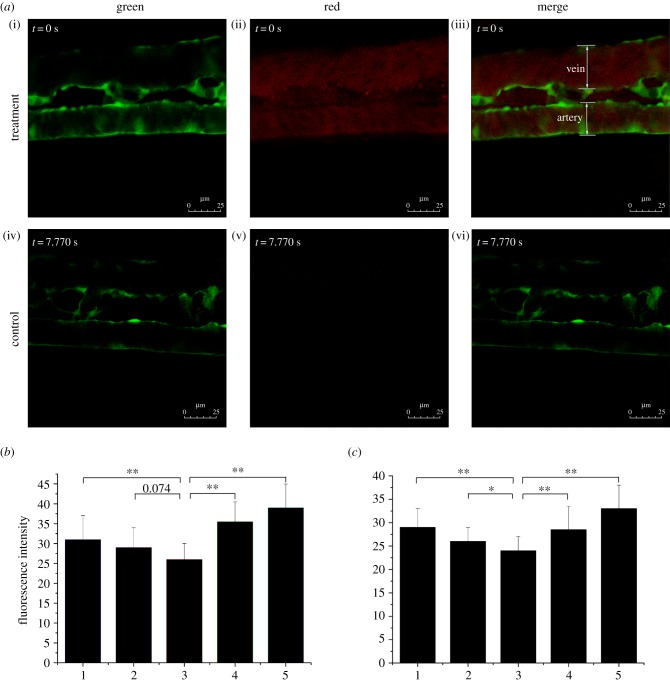
Figure 4.
LDL concentration polarization in the vascular system. (a) Flk1: GFP embryos at 52 h.p.f.; stills from electronic supplementary material, movies S1 and S2; (i–iii) embryos injected with DiI–LDL at 48 h.p.f. (n = 56/60) and (iv–vi) control (n = 58/60); endothelial cells are green; DiI–LDL is red. (b,c) Red fluorescence intensity of (b) a vein and (c) an artery. Number 1 to 5 indicates the sample location in the vessel (figure 2a (ii,iv,vi)): 1 and 5 are the luminal surfaces of the blood vessel; 2 and 4 are between the luminal surface and centre of the blood vessel; and 3 is the centre of the blood vessel (*p < 0.05; **p < 0.01).

