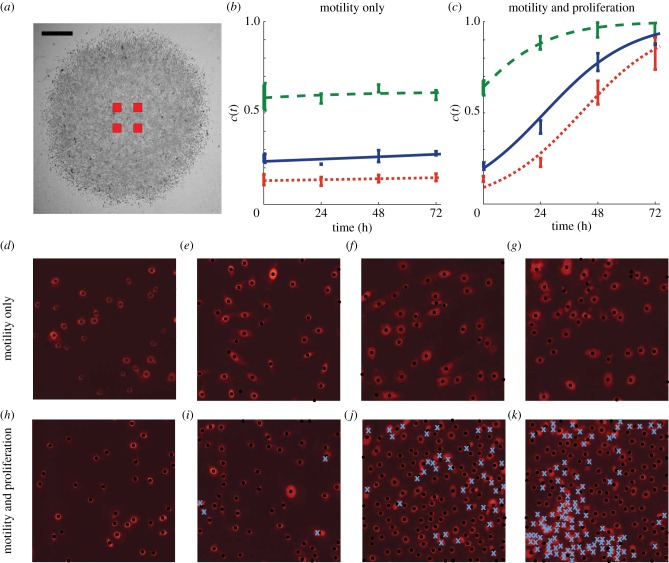
Figure 2.
Proliferation in the barrier assay was quantified by counting the number of cells in four different subregions in each experimental replicate. The relative size and approximate location of the subregions are shown in (a), where the scale bar corresponds to 1.5 mm. The number of cells in the subregions were counted, and the corresponding time evolution of the mean scaled cell density is shown in (b,c), with error bars indicating one standard deviation from the mean. Dotted, solid and dashed curves in (b,c) correspond to appropriately parametrized logistic growth curves for the experiments where 5000, 10 000 and 30 000 cells were placed initially in the barrier, respectively. Images in (d–g) show four subregions of dimensions 400 × 400 μm for the experiment where 5000 cells were initially placed inside the barrier after pretreatment with mitomycin-C. The images in (d–g) correspond to t = 0, 24, 48 and 72 h, respectively. The PI staining highlights each cell nucleus. Black dots indicate cells that were automatically identified using the image analysis software. Results in (h–k) show equivalent images from an experiment without mitomycin-C pretreatment. The crosses in (i–k) indicate cells that were manually counted. (Online version in colour.)

