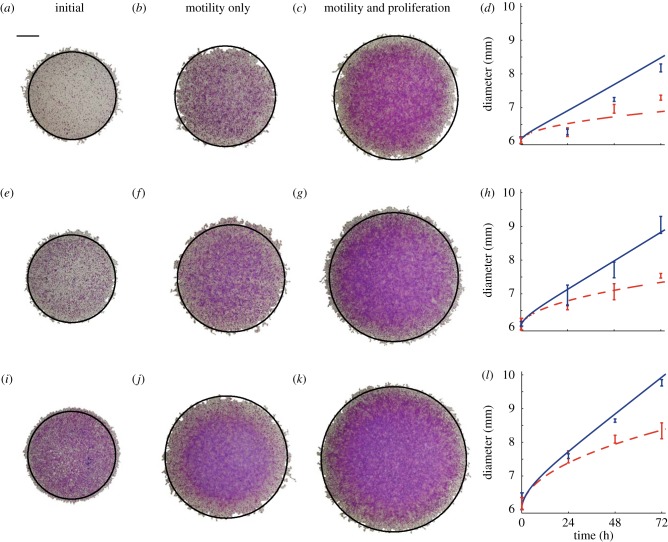
Figure 3.
The position of the leading edge was determined by analysing experimental images for the experiments with (a–d) 5000, (e–h) 10 000 and (i–l) 30 000 cells initially. Images are shown at t = 0 (a,e,i), at t = 72 h for the experiments with mitomycin-C pretreatment (b,f,j) and at t = 72 h for the experiments without mitomycin-C pretreatment (c,g,k). In each image, the c(r,t) = 0.017 contour of the relevant solution of equation (3.1) is superimposed in black (solid) on the spreading population and the scale bar represents 1.5 mm. Results in (d), (h) and (l) show the mean diameter (n = 3) calculated from experimental images at t = 0, 24, 48 and 72 h, with the error bars representing one standard deviation from the mean. The curves in (d), (h) and (l) represent the time evolution of the position of the c(r,t) = 0.017 contour of the relevant solution of equation (3.1). The solid curves correspond to spreading driven by combined motility and proliferation, whereas the dashed curves correspond to spreading by motility only. The numerical solution of equation (3.1) corresponds to δr = 1.0 μm, δt = 0.005 h and ε = 1 × 10⁻⁶. (Online version in colour.)

