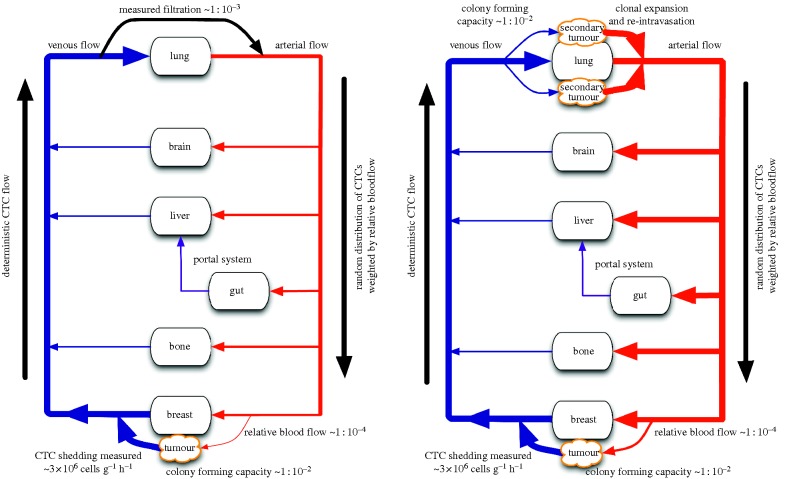
Figure 1.
A schematic of a patient with a tumour in the breast showing anatomic structures as nodes in a network with physiologic vascular connections as edges. Thickness of vascular connections correlates with relative number of CTCs on a log-scale. (a) Primary seeding schematic and (b) secondary seeding schematic.

