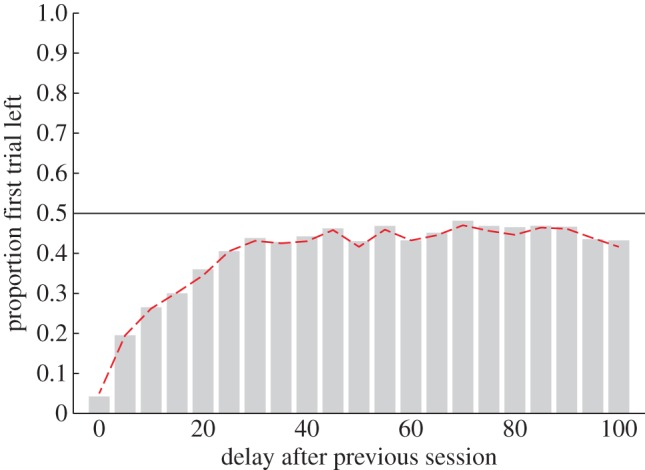
Figure 3.

Spontaneous recovery. Bars show the proportion of simulation runs (runs = 1000) choosing the left arm on a single test trial as a function of delay (number of sequential samples from the generative model) between the end of initial training and the test trial. Training consisted of 50 trials under a 100 : 0 reinforcement schedule (left arm always rewarded; ‘context A’) followed by 50 trials under the reversed 0 : 100 schedule (right arm always rewarded; ‘context B’), with reward r = 4. Also shown is the proportion of simulation runs sampling ‘context A’ on the test trial (dashed line). (Online version in colour.)
