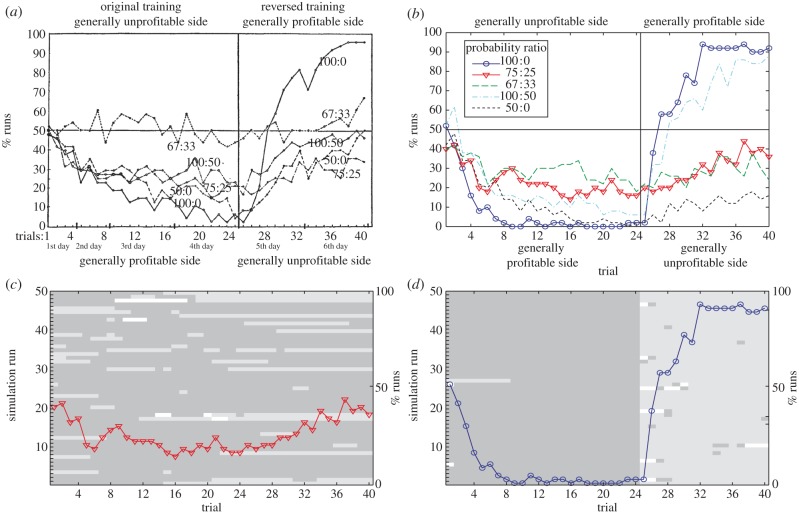
Figure 4.
(a) Brunswik's rat data (adapted from [4]). The choices of different experimental groups (48 rats in each) in a T-maze were rewarded according to various probability ratios (100 : 0, 50 : 0, 75 : 25, 100 : 50 and 67 : 33). The reinforcement schedules were reversed after 24 trials. (b) As with Brunswik's rats, the model quickly reverses its preference of arm following reinforcement schedule reversal for the 100 : 0 case, but only slowly modulates its choice in the 75 : 25 case. The difference in behaviour arises due a tendency to assign most observations in the 75 : 25 case to a single context (c), while in the 100 : 0 case two distinct contexts are correctly inferred (d). Learning curves are averages over 50 simulation runs. In figures c,d, for each of the 50 simulation runs, we look at the sequence of contexts to which observations are assigned. Thus, for each simulation run, there is a horizontal line of small rectangles which indicates the context to which the observation on the current trial is assigned on that particular simulation run. The identity of the context is indicated by the greyscale value of the rectangles so that differences in greyscale denote assignments of observations to distinct contexts. In the 75 : 25 case, observations are either assigned to a single context, as indicated by a line with no change in greyscale, or are assigned to distinct contexts in an irregular fashion as indicated by the irregular pattern of changes in greyscale. By contrast, in the 100 : 0 case, there is a clear switch in context assignment after trial 24, when the reinforcement schedule is switched. This is reflected by the systematic change in greyscale for each simulation at this point. Reward r = 4 for all simulations. (Online version in colour.)

