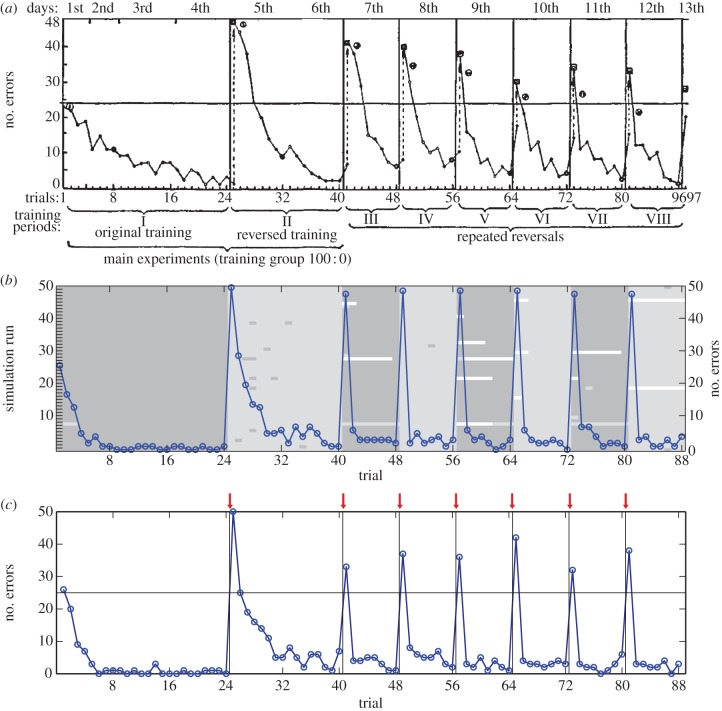
Figure 7.
Serial reversal learning. (a) Brunswik's serial reversal-learning data (adapted from [4]): total number of errors (i.e. choices of the unrewarded arm) per trial for 48 rats with repeated reversal of the 100 : 0 reinforcement schedule. (b) Total number of errors for 50 simulation runs on the serial reversal-learning task. Rewards observed under the reversed and non-reversed reinforcement schedule tend to be assigned to distinct clusters in each individual run, as indicated by shading. (c) Total number of errors for 50 simulation runs on the serial reversal-learning task with the addition of temporal delays (generative model samples = 10) between reversals (as indicated by vertical black lines and arrows above graph). (Online version in colour.)

