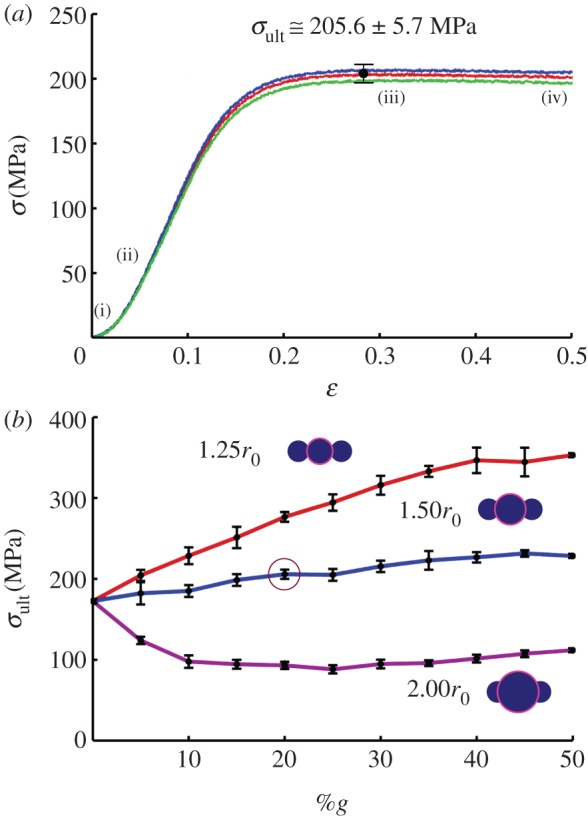
Figure 7.

Global stress–strain response and ultimate stress. (a) Representative fibre stress (σ) versus strain (ɛ) for rg = 1.50r0 and 20%g. The stresses and strains are representative to the shear transfer contribution only. The typical stress response is nonlinear stress increase, followed by saturation and nominal decrease as the fibrils slip along the fibre axis. Slippage initiates prior to a maximum stress, at approximately ɛ > 10%, which visually corresponds with the onset of system softening. Three curves depict three random distributions, maximum stress taken as the mean (with the variance accounting for the uncertainty in radii determination). The indicated points (i), (ii), (iii) and (iv) correspond with the snapshots from figure 6. (b) The curves were attained for all models, and the ultimate stress (σult) plotted as a function of %g (result from (a) indicated by circle). While the uncertainty is on the order of ±5%, the trends between each rg value is clear. Addition of slightly larger fibril globules enhances interlock while only nominally increasing the require fibre volume. As a result, each additional globule enhances shear transfer, as it interlocks with an adjacent fibril, while allowing interaction between adjacent fibril sections. However, as larger globules interact (rg = 1.50r0 and 2.00r0), they prevent adjacent fibril sections of nominal radius from contact, thus decreasing the total interfibril interaction and stress transfer. For the largest globules (rg = 2.00r0), the required volume (i.e. equilibrium radius) exceeds the benefit of fibril interlock. Addition of a few large globules must be accommodates by a large fibre radius, leaving significant unused fibril length (non-interlocking sections). (Online version in colour.)
