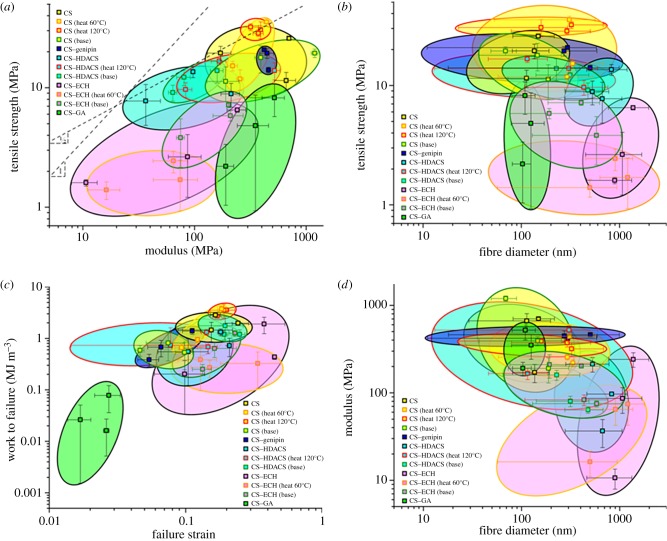
Figure 4.
(a) Plotting tensile strength against Young's modulus demonstrates the range of properties. (b) Tensile strength plotted against the fibre diameter. (c) Work to failure plotted against failure strain. (d) Young's modulus plotted against the fibre diameter. The marker fill colour refers to the composition, while the outline colour indicates the post treatment, or the lack thereof. Black outline denotes no post treatment, orange denotes heat treatment of 60°C, red denotes heat treatment of 120°C and green denotes base treatment. Bubbles group all the tested samples for a given composition and treatment.

