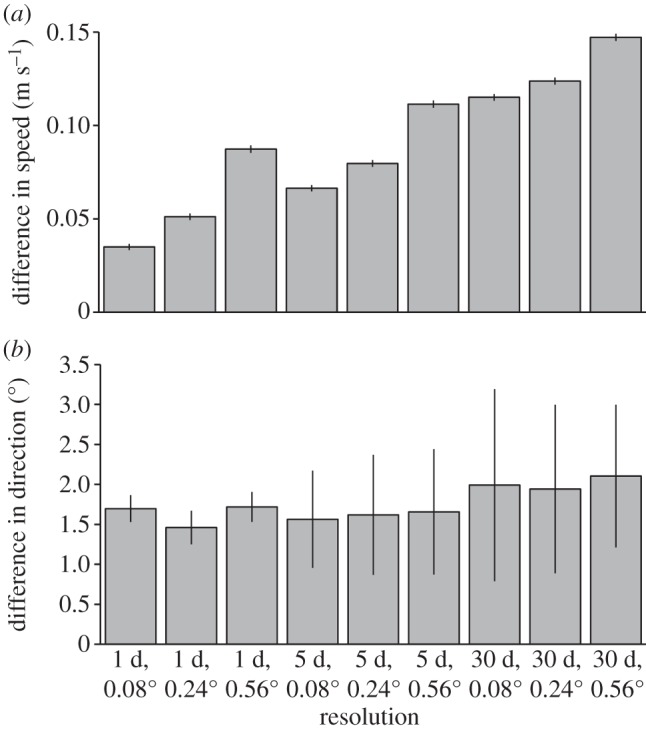
Figure 2.

The mean daily difference in velocity between 50 drifters and predictions for each model output resolution. Error bars indicate the 95% CI of the mean. (a) Positive values indicate that the speed of the drifter was greater than modelled predictions. (b) Positive values indicate that the direction of the drifter was more clockwise than modelled trajectories.
