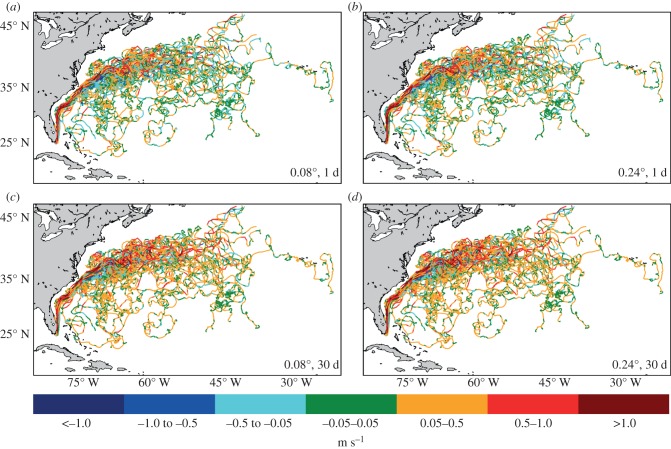
Figure 3.
Difference in speed along 50 tracks of surface drifters, relative to model predictions. Green indicates portions of the track where model predictions were within ±0.05 m s−1 of the observed drifter. Warmer colours (reds) indicate portions of the track where drifters moved faster than model predictions, cooler colours (blues) indicate portions of the track where drifters moved slower than model predictions. Differences shown for model output at (a) 0.08°, 1 day; (b) 0.24°, 1 day; (c) 0.08°, 30 days and (d) 0.24°, 30 days.

