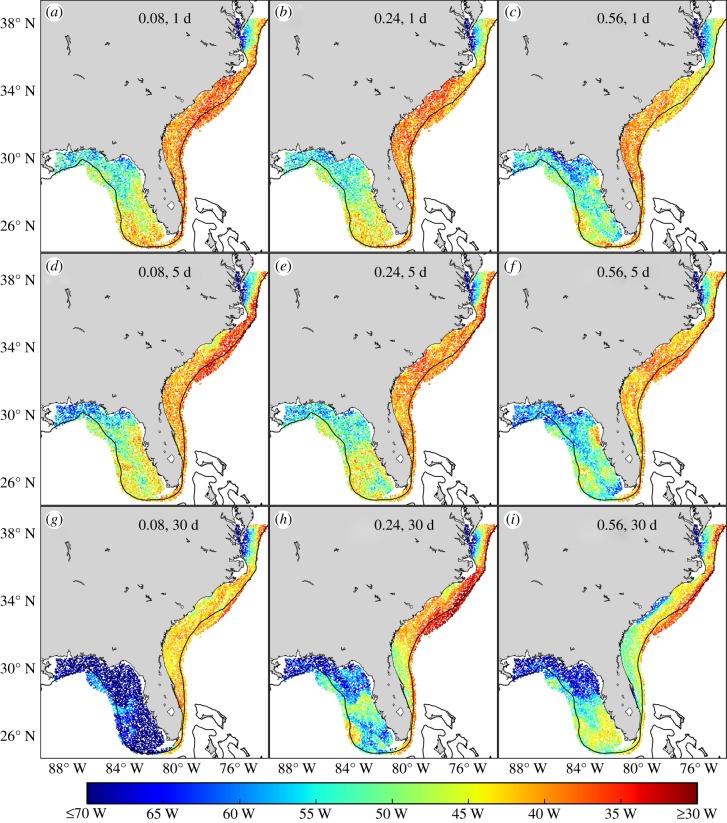
Figure 7.
Mean eastern-most longitude after 3 years based on start location. (a) Native model output, 0.08° spatial resolution, 1 day temporal resolution; (b) 0.24°, 1 day; (c) 0.56°, 1 day; (d) 0.08°, 5 days; (e) 0.24°, 5 days; (f) 0.56°, 5 days; (g) 0.08°, 30 days; (h) 0.24°, 30 days and (i) 0.56°, 30 days.

