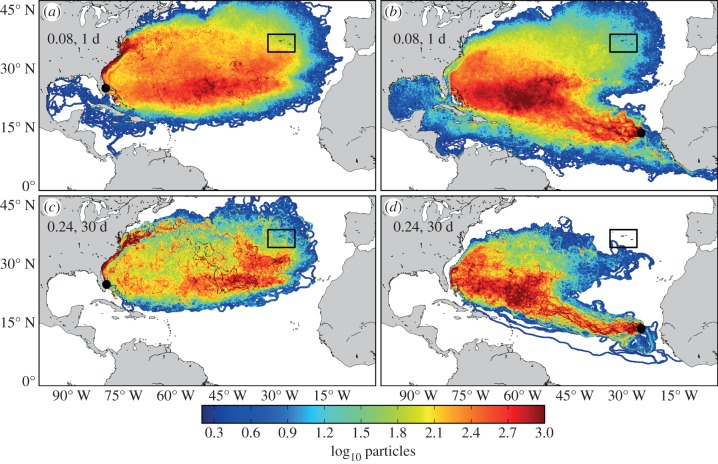
Figure 8.
Distribution of 7500 particles tracked for 5 years from southeast Florida and the Cape Verde Islands. The colours indicate the number of particles within each 0.08° × 0.08° area throughout the 5 year simulation. The colours are scaled logarithmically (i.e. log10(n+1), where n is number of particles at a particular location through time). The black rectangle around islands in the northeastern Atlantic indicates the Azores, an important foraging area for young turtles. (a) Paths taken by particles released off the coast of Florida (black dot) when released into the native model output (0.08°, 1 day). (b) Paths taken by particles released off the Cape Verde Islands (black dot) when released into the native model output (0.08°, 1 day). (c) Same as in (a) but particles were released into coarser model output (0.24°, 30 days). (d) Same as in (b) but particles were released into coarser model output (0.24°, 30 days).

