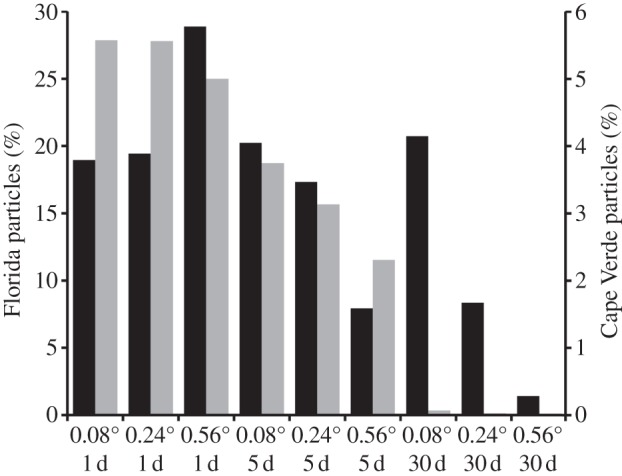
Figure 9.

Percentage of particles reaching the Azores within 5 years from Florida, USA (black bars) and the Cape Verde Islands (grey bars). The scale of the left-hand y-axis is for particles originating from Florida; the scale on the right-hand y-axis is for particles originating from Cape Verde.
