
Figure 3.
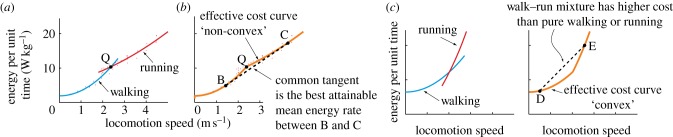
(a) Metabolic energy rate for walking and running as a function of speed, intersecting at speed v = VQ. (b) The combined ‘effective cost curve’ is shown in orange, by picking the gait that has the lower cost at every relevant speed: resting at v = 0, walking below VQ, and running above VQ. Walking at speed VB and running at VC for different fractions of time results in an average metabolic rate as given by the line BC. When BC is the unique common tangent to the two curves, switching between B and C results in a lower average metabolic rate than is possible by exclusively walking or running (in fact the lowest possible for this model). This lowering of cost is possible because of the ‘non-convexity’ of the effective cost curve. (c) Hypothetical metabolic rate curves for walking and running that result in a ‘convex’ effective cost curve, implying no direct energetic benefit from walk–run mixtures.