
Figure 4.
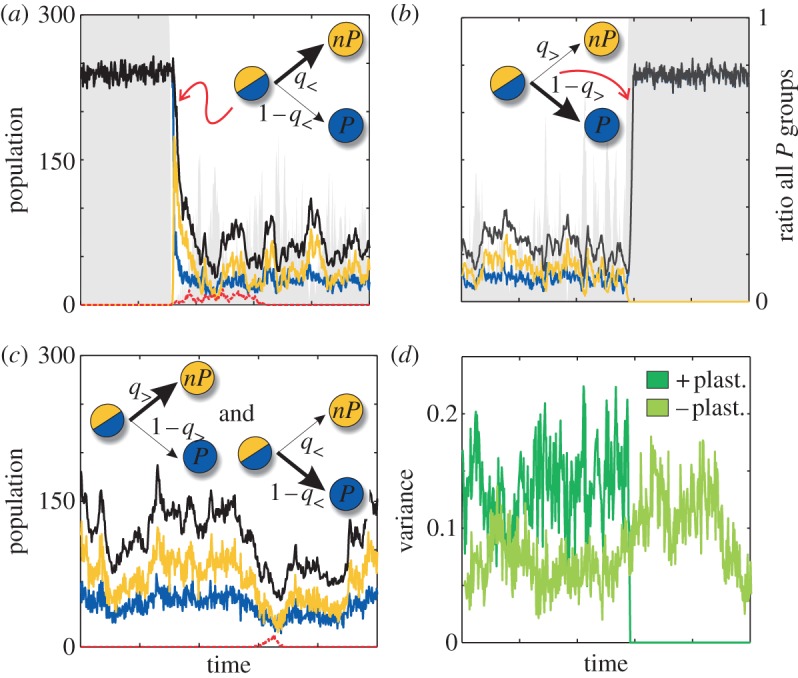
Positive and negative plastic producers include a sensing mechanism. (a) Positive plastic producers expressing a P state quickly switch to nP as response to cheaters. This causes a fast reduction of Ps overall (arrow thickness in inset cartoons denotes preferred individual decisions). After cheater invasion is stopped, the population exhibits coexistence of P and nP to finally evolve to an all P scenario (b) (for better visualization we show only a limited part of the coexistence). Shading areas in (a,b) denote the relative amount of groups composed by only Ps. (c) A population of negative plastic producers is characterized by its permanent low density favoured by the constant presence of nP which helps controlling cheaters invasion. (d) Positive plasticity transiently modifies the inter-group variance to control cheaters and stop the emergence of nPs. This contrasts with the relatively constant variance observed in a population of negative plastic producers (variances correspond to time series (b) and (c), respectively). Plastic producer definitions and colour code as figure 1, with q>=0, q<=0.7 and θ = 1 for positive plasticity and q> = 0.7, q< = 0 and θ = 0.1 for negative; black curve describes total population. Parameters: k = 300, N = 10, δ = 0.2, c = 1, ν = 5 × 10⁻⁶ (all panels); (a,b) r = 2 and (c) r = 2.2.