
Figure 5.
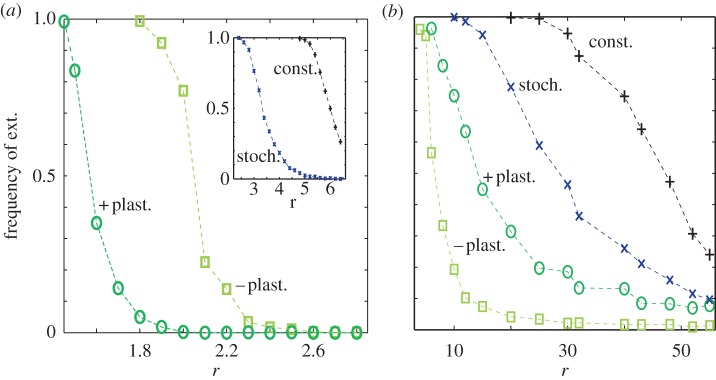
Individual strategies differentially manage sustainability in the commons. Extinction frequencies observed by individuals exhibiting constitutive (black), stochastic (blue) and positive/negative (dark/light green) plasticity in a population structured in small ((a), N = 10) or large ((b), N = 60) groups (as a function of r). We considered 1000 independent runs with 6 × 10⁵ steps (electronic supplementary material, figures S8 and S9 considered a different k and longer time series, respectively). For the curves corresponding to positive, negative plasticity and stochastic producers, the values plotted correspond to the minimal extinction frequency obtained by considering all possible instances of positive, negative and stochastic producers, respectively (see electronic supplementary material, figures S5–S7 for details). Other parameters are k = 300, c = 1, δ = 0.2, ν = 5 × 10⁻⁶.