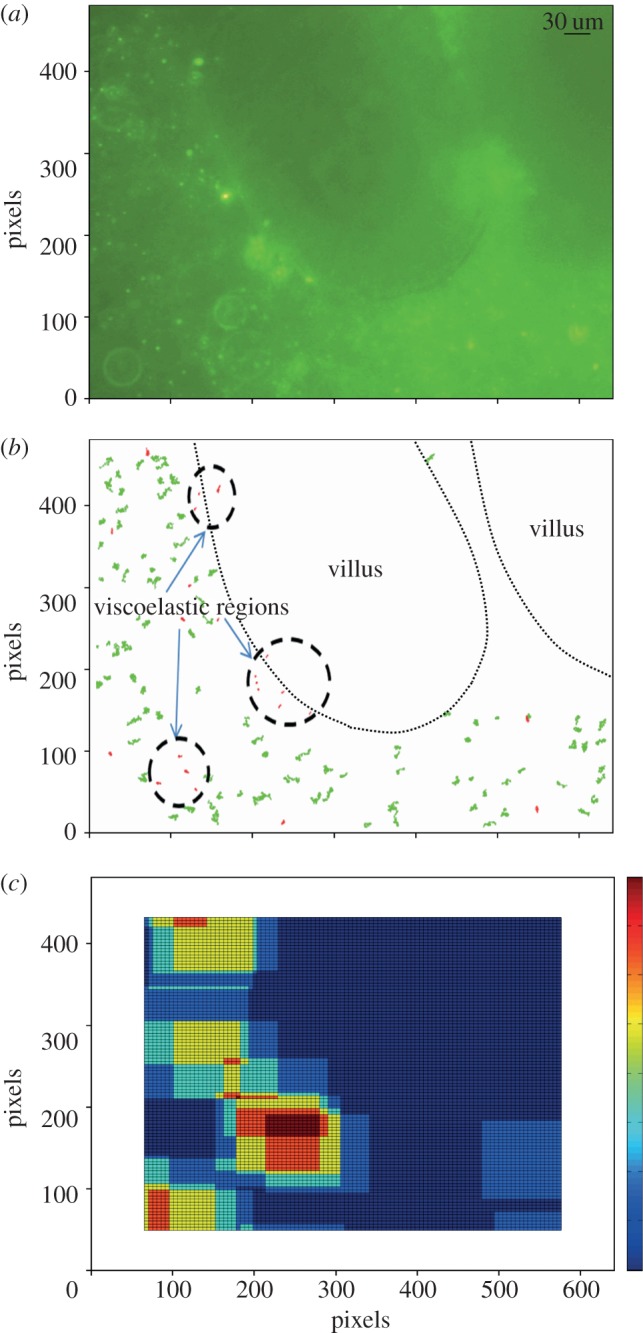
Figure 3.

Mapping of viscoelastic regions. (a) Photomicrograph showing the location of the villi and the distribution of microbeads. (b) A direct plot of the trajectories of a field of microbeads allows the sub-diffusive trajectories (coded red) of beads within viscoelastic regions to be distinguished from the more extensive diffusive trajectories of microbeads (coded green) within the continuous fluid phase. (c) Output from the BCA that delineates viscoelastic regions containing groups of beads with sub-diffusive MSDs.
