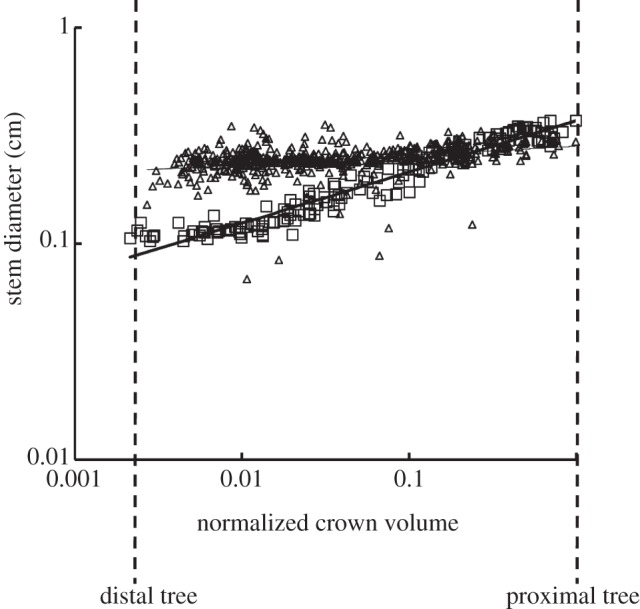
Figure 4.

A log–log plot of stem diameter (Ds) versus normalized crown volume (Vc/Vcmax) for all data of epicardial coronary arterial trees of the control (square symbols) and high-fat diet (triangle symbols) groups, where Vcmax is the sum of the intravascular volume of each vessel segment in an entire epicardial coronary arterial tree reconstructed from CT scans. The thick and thin solid lines represent the least-square fit of all the measurements to the volume–diameter scaling power law for the control (R2 = 0.15) and high-fat diet groups (R2 = 0.93), respectively.
