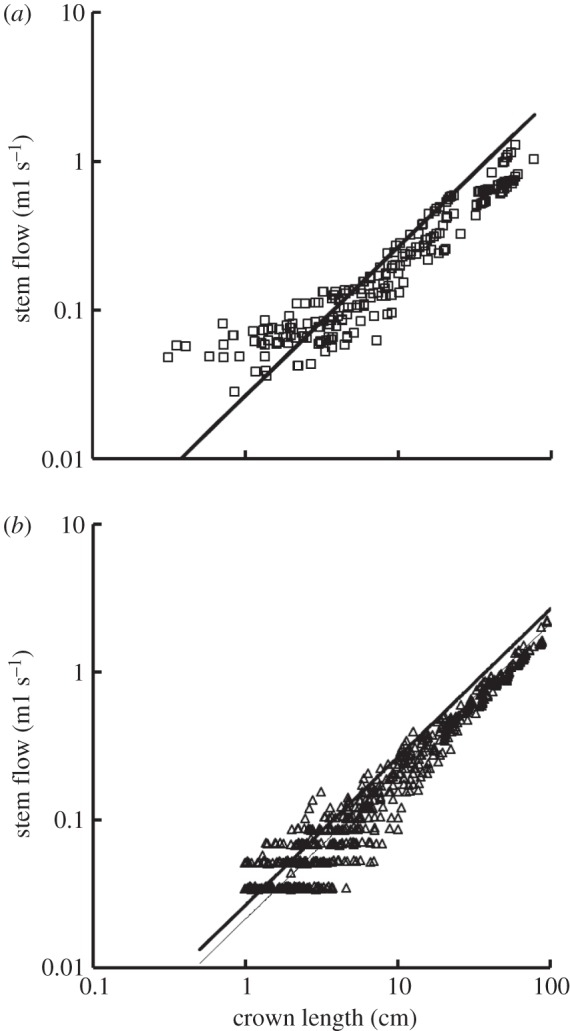
Figure 7.

A log–log plot of stem flow (Qs) versus crown length (Lc) for all data of epicardial coronary arterial trees of the (a) control (square symbols) and (b) high-fat diet (triangle symbols) groups. The thick solid lines represent the least-square fit of all the measurements in the control group to the flow–length scaling power law (Qs = 2.68 × 10⁻² × Lc, R2 = 0.89), whereas the thin solid line refers to the least-square fit of all the measurements in the high-fat diet group to the flow–length scaling power law (Qs = 2.15 × 10⁻² × Lc, R2 = 0.93). Two-way ANOVA was used to compare all the measurements between the high-fat diet and control groups, which show no significant difference (p-value = 0.20).
