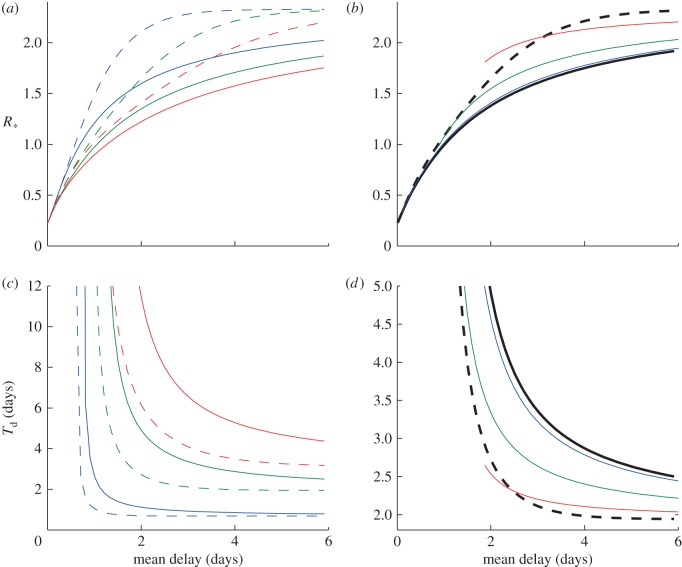
Figure 2.
General behaviour of antivirals. Household basic reproduction number, R*, and doubling time early in the pandemic, Td, as a function of the mean delay to antiviral allocation for the SEEIIR model. The mean delay is taken as the time from the first infectious case to when antivirals take effect. This is composed of notification and further allocation delay. (a,c) SEEIIR with constant and exponential delay. (b,d) SEEIIR with notification (σ = 1). Dashed and solid lines are from the constant and exponential delay models, respectively, for three values of σ, where 1/σ is the average exposed period. (b) The coloured lines show the model results with notification for σ = 1. Black dashed and solid lines are constant and exponential delay models, respectively. The coloured curves end at minimum delay possible for a given value of the notification rate, rn. (c,d) The doubling time, using the same colour scheme. Other parameters: k = 3, βk = 2, α = 1, γ = 1, τ = 0.8 and ρ = 0.8. All rates are given in terms of days–1. (a,c) Blue lines, σ = 50; green lines, σ = 1; red lines, σ = 0.5. (b,d) Blue lines, rn = 10; green lines, rn = 1; red lines, rn = 0.2.

