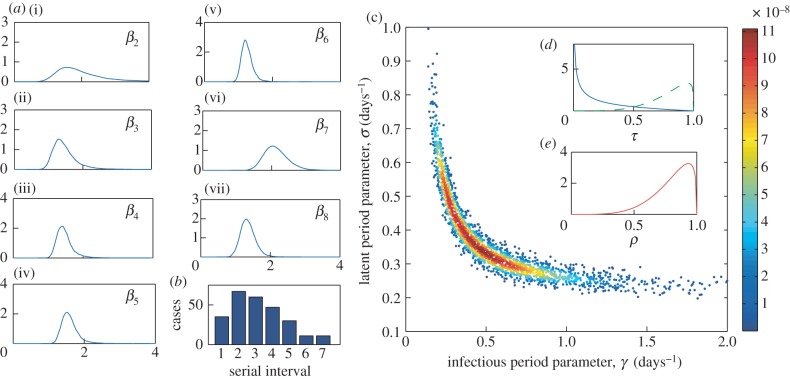
Figure 4.
Pandemic influenza parameter estimates. (a(i–vii)) Kernel density plots for the within-household transmission rate, βk, from 10 000 random samples from the posterior distributions given in [24]; (c) 2000 (randomly selected from the 10 000) random samples for the posterior distribution for the infectious and latent period parameters, γ and σ, estimated by fitting to the serial interval data (b); points are coloured according to their likelihood value as per the scale on the right. (d,e) The posteriors for the reduction in transmission, τ, (for both zanamivir (blue) and oseltamivir (green)) and the reduction in susceptibility, ρ.

