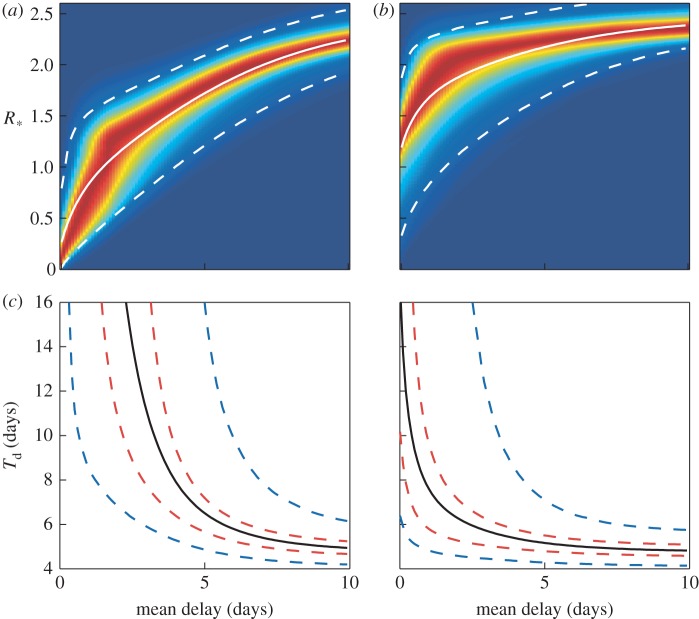
Figure 6.
Pandemic model results for the constant delay model. (a,b) Kernel density plots for the household reproductive ratio, R*, as a function of the mean delay to allocation for the two types of antivirals oseltamivir and zanamivir. Solid and dashed white curves in (a) and (b) mark the mean and the 95% credible intervals of these distributions, respectively. (c,d) The doubling time, Td, as a function of the mean delay for oseltamivir and zanamivir, respectively. Black lines show the mean, and dashed red and blue lines show the 50% and 95% credible intervals, respectively.

