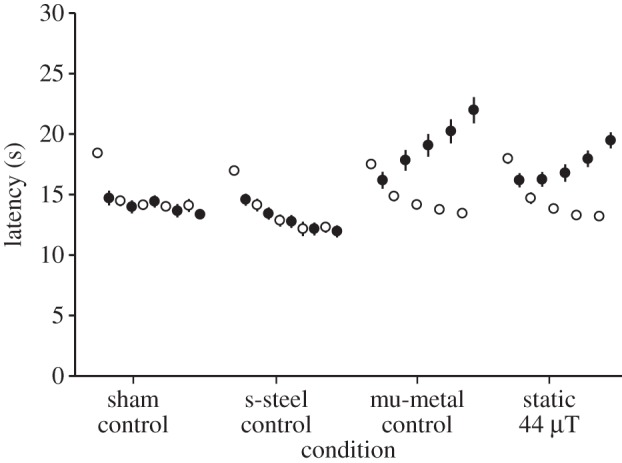
Figure 3.

Pre- (open circles) and post-exposure (filled circles) latencies for a 44 µT static field exposure as well as a fibreglass sham, a stainless steel control and a 0 nT mu-metal positive control. The five entries for each of the four conditions refer to the five experimental days. Error bars correspond to ±standard error of the mean (s.e.m.). Where SEM bars are not evident, they fall within the symbols. The ANOVA analysis showed a significant three-way interaction between day (5, repeated) by pre–post (2, repeated) by condition (4, independent) (F2,38 = 5.98, p < 0.001, η2 = 0.13).
