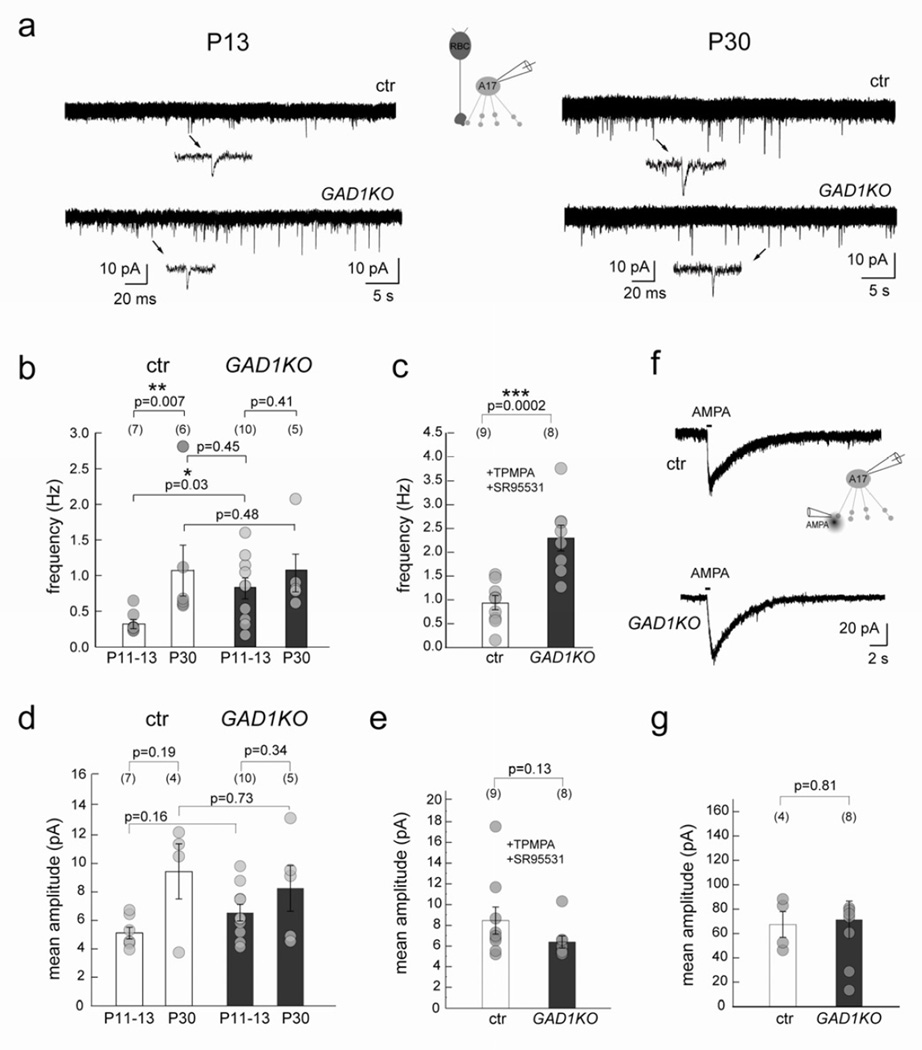
Figure 7. RBC output is transiently increased in GAD1KO retina during circuit development.
(a) sEPSCs recorded from A17 amacrine cells at P13 and P30 in GAD1KO and littermate control retina shows an increase during normal development (ctr). (b) The sEPSC frequency was increased for A17 amacrine cells in GAD1KO as compared to ctr early in development at P13, but was comparable to control at P30. (c) Mean frequency of sEPSCs from P11–13 A17 amacrine cells in GAD1KO and ctr in the presence of GABA receptor antagonists TPMPA and SR95531, also showed increased frequency in the GAD1KO. (d) Mean sEPSC amplitudes recorded in A17s from littermate control and GAD1KO at P11–13 and P30 revealed no differences. (e) Mean amplitude of sEPSCs recorded from P11-P13 A17 amacrine cells in GAD1KO and ctr in the presence of GABA receptor antagonists TPMPA and SR95531 showed no difference. (f) Example traces showing AMPA puff evoked cation-mediated inward currents from A17 cells clamped at −60 mV evoked by AMPA puffs in ctr and GAD1KO at P11–13. Scatter plots show that the mean amplitude (g) is comparable between genotypes. Numbers in brackets represents number of cells. Asterisk marks significant difference. Error bars represent S.E.M.

