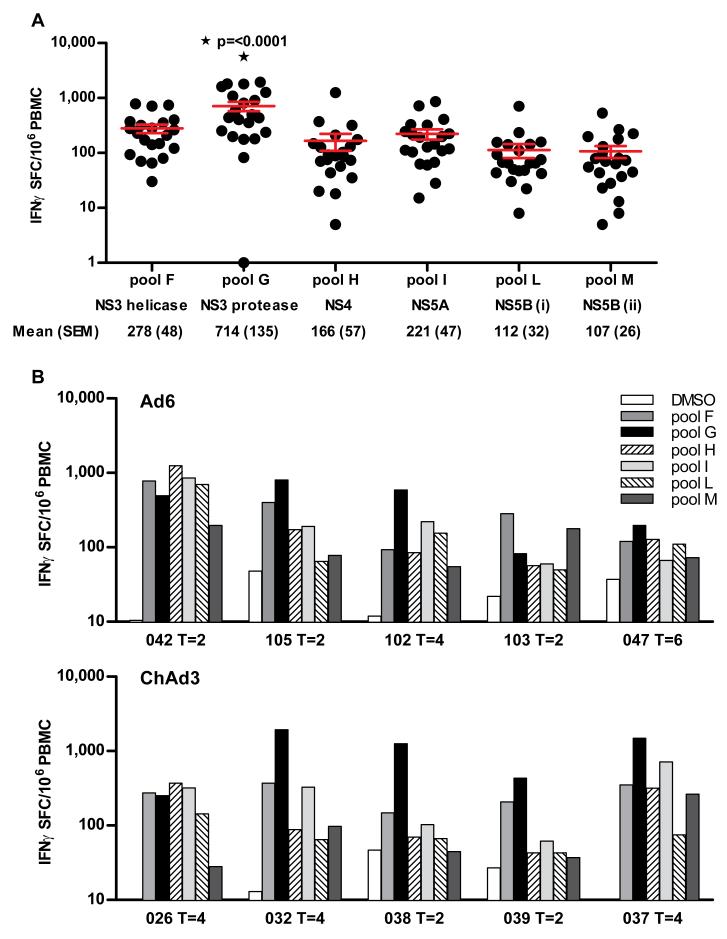
Figure 3. Specificity of T cell responses primed after vaccination with Ad6-NSmut or ChAd3-NSmut.
(A) Immunodominance of primed responses: Data are taken from the IFNγ ELISpot responses from high dose groups (3, 9; Ad6-NSmut 2.5 ×10¹⁰ vp and 7, 10; ChAd3 2.5 ×10¹⁰vp) at peak magnitude after prime. The magnitude of the HCV-specific T cell response to individual peptide pools (F-M), and the corresponding NS protein below is shown (Bars=mean +/− SEM, ▯=statistical significance p=0.0001).
(B) Individual volunteer data showing targeted pools after priming with Ad6-NSmut 2.5 ×10¹⁰ vp group 3 (upper panel) and ChAd3-NSmut 2.5 ×10¹⁰vp group 7 (lower panel) is shown.

