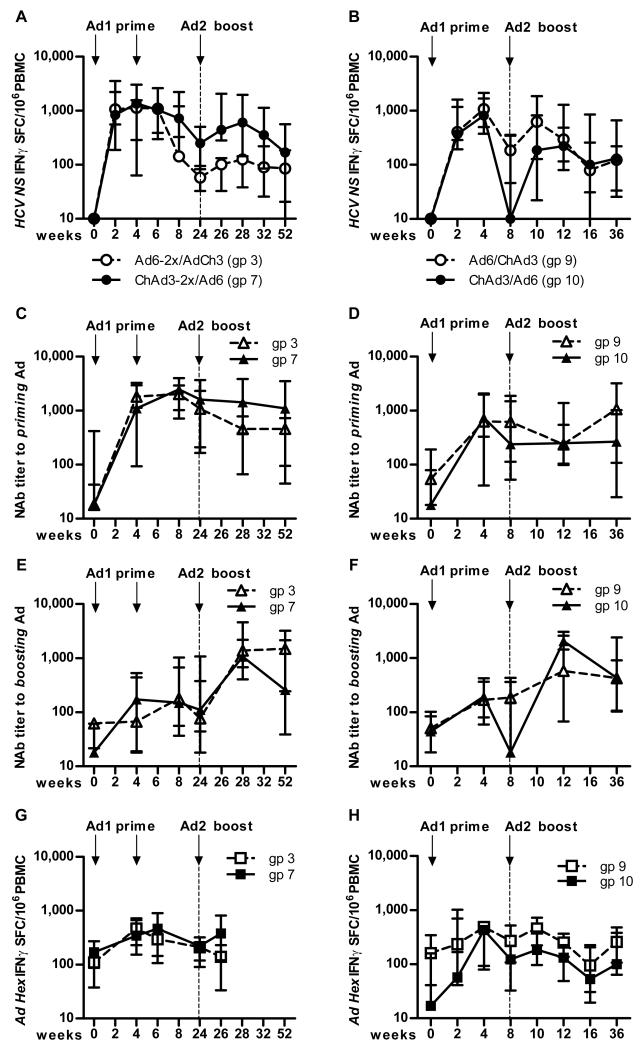
Figure 6. Boosting of T cell responses primed after vaccination with Ad6-NSmut or ChAd3-NSmut.
(A and B). Boosting of primed responses: A. Group data from IFNγ ELISpot responses in high dose double prime groups (3; Ad6-NSmut 2.5 ×10¹⁰ vp and 7; ChAd3-NSmut 2.5 ×10¹⁰ vp) over time. The responses shown are the total positive IFNγ ELISpot response across all pools (see methods) presented as group medians and IQR. Open symbols indicate Ad6-NSmut priming (ChAd3-NSmut boost) and shaded symbols ChAd3-NSmut priming (Ad6-NSmut boost). B. Similar data for groups 9 and 10 (single prime groups)
(C-F) Neutralizing antibody titers (Nab): Homologous (against priming vector) (C, D) and heterologous (against boosting vector) (E, F) NAb titers are shown presented as group medians and IQR: Open symbols indicate Ad6-NSmut priming (ChAd3-NSmut boost) and shaded symbols ChAd3-NSmut priming (Ad6-NSmut boost). C and E show double-primed groups 3 and 7; D and F show single primed groups 9 and 10.
(G and H) Adenovirus specific responses after priming and boosting: Group data from IFNγ ELISpot responses in high dose groups (G double prime, and H single prime groups) over time. The responses shown are the total positive IFNγ ELISpot response across to Ad5 Hexon peptides (see methods) presented as group medians and IQR. Open symbols indicate Ad6-NSmut priming (ChAd3-NSmut boost) and shaded symbols ChAd3-NSmut priming (Ad6-NSmut boost).

