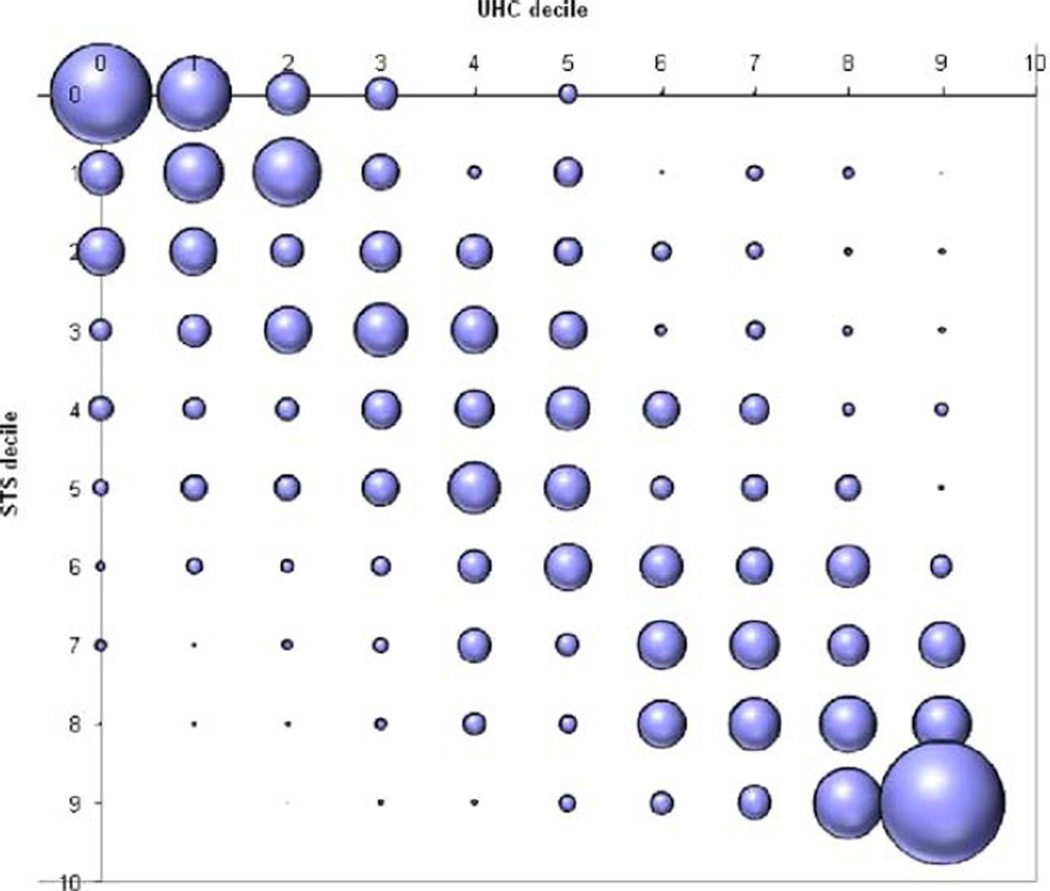
Figure 1.
Proportion of patients matched by deciles of predicted mortality. Between STS and UHC scores; the bubble plot of the specific distribution of the agreement and disagreement between models across deciles. The UHC and STS deciles of predicted mortality risk are shown on the X and Y axis, respectively. Each bubble is sized to depict the relative total proportion of the study population matched by deciles of predicted mortality between the STS and UHC scores. STS, Society of Thoracic Surgeons; UHC, University HealthSystem Consortium.

