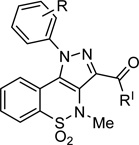
Table 1.
Biological results obtained for derivatives 3a, 4a-j, 5a, and 6a.
 | ||||||||||
|---|---|---|---|---|---|---|---|---|---|---|
| cpds | R | R' | SPR on NS5B |
NS5B functional assay |
Replicon assay on Huh 5-2 cells |
LLE (KD)g | LLE (IC50)h | |||
| KD (µM)a |
IC50 (µM)b |
EC50 (µM)c |
EC90 (µM)d |
CC50 (µM)e |
SIf | |||||
| 3a | 3-F | OMe | >300 | NDi, j | 172 ± 10 | NDi | >323 | 2 | - | - |
| 4a | 3-F | 75±12 | 21.0±2.8 | 7.5 ± 2.5 | 42 ± 2 | >370 | >49 | 1.85 | 2.40 | |
| 4b | 2-F | 162±63 | 14.2±0.6 | 6.4 ± 0.2 | NDi | >231 | >36 | 1.61 | 2.66 | |
| 4c | 4-F | NDi | 3.9±0.3 | 23 ± 13 | NDi | >231 | >10 | - | 3.11 | |
| 4d | H | 53±6 | 19.8±3.6 | 14 ± 1 | NDi | >239 | >17 | 2.18 | 2.61 | |
| 4e | 3-NO2 | 14±6 | NDi, j | >220 | >220 | >220 | ≥1 | 3.41 | - | |
| 4f | 2-NO2 | 35±3 | 20±0.4 | 17.8 ± 0.1 | NDi | >220 | >12.4 | 2.84 | 3.09 | |
| 4g | 4-NO2 | NDi | 7.7±1.3 | 7.9 ± 1.0 | NDi | 55 ± 8 | 7.0 | - | 3.80 | |
| 4h | 3-NH2 | 163±8 | NDi, j | 9.2 ± 0.9 | NDi | 20 ± 6 | 2.2 | 2.52 | - | |
| 4i | 2-NH2 | 106±42 | 39.9±1.7 | 26 ± 2 | NDi | >232 | >9 | 2.66 | 3.08 | |
| 4j | 4-NH2 | 165±16 | 18.2±2.1 | 12 ± 1 | NDi | 25 ± 5 | 2 | 2.53 | 3.48 | |
| 5a | 3-F | 161±103 | NDi, j | 19 ± 2 | NDi | >270 | >14 | 0.99 | - | |
| 6a | 3-F | 63±8 | NDi, j | 88 ± 10 | NDi | >185 | >2 | 1.87 | - | |
KD= Dissociation equilibrium constant. At this concentration 50% of all binding site are occupied. Values as averages and standard deviation (SD) from duplicate or triplicate runs.
IC50 = concentration of compound that inhibits 50% enzyme activity in vitro. The reported values represent the means ± SD of data derived from two independent experiments performed in duplicate.
EC50 = the effective concentration required to inhibit virus induced cytopathic effect by 50%. The reported values represent the means ± SD of data derived at least from three independent experiments.
EC90 = the effective concentration required to inhibit virus induced cytopathic effect by 90%. The reported value represents the means ± SD of data derived at least from three independent experiments.
CC50 = is the concentration required to reduce the bioreduction of MTS (3-(4,5-dimethylthiazol-2-yl)-5-(3-carboxymethoxy-phenyl)-2-(4-sulfophenyl)-2H-tetrazolium) into formazan by 50%. The reported value represents the means ± SD of data derived at least from three independent experiments.
SI = selectivity index (ratio of CC50 to EC50).
LLE(KD) = pKD – predicted logP.
LLE(IC50) = pIC50 – predicted logP.
ND = not determined.
Compounds that did not reach the 50% inhibition and show a maximum % inhibition @ 50 µM: 3a 10.6%, 4e 33.7%, 4h 45.8%, 6a 21.4%, 5a 31.5%.
