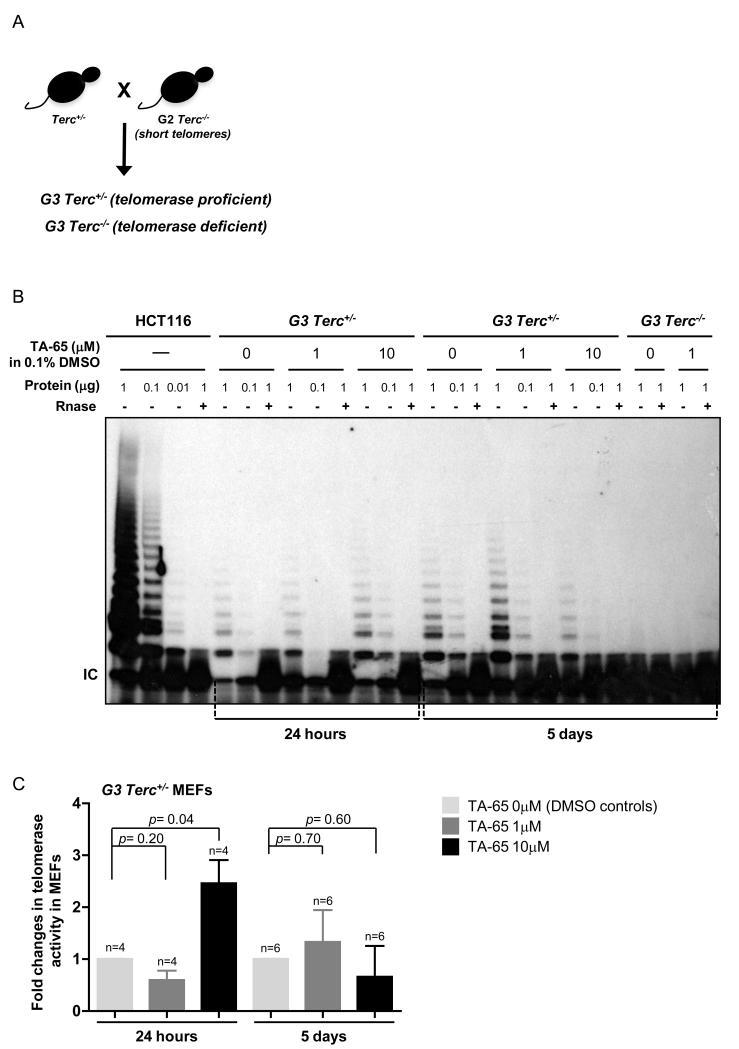
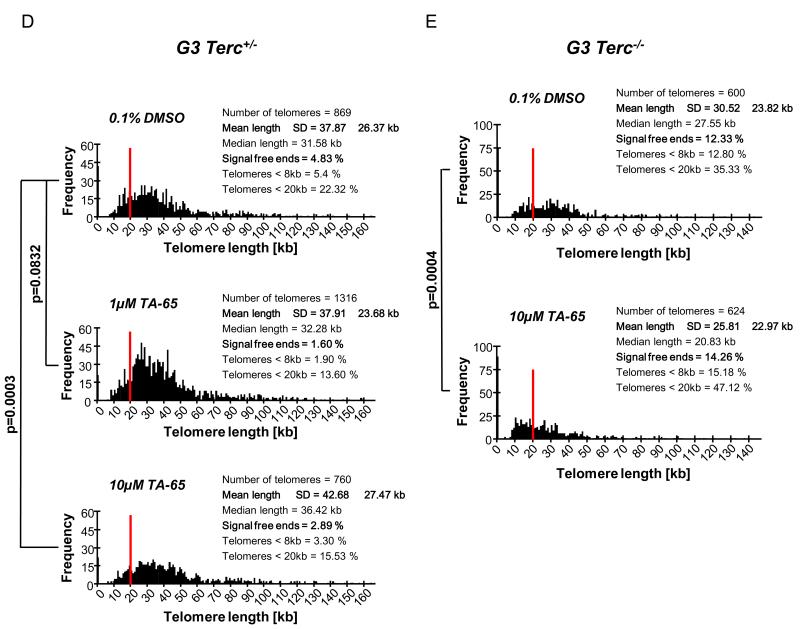
Figure 1. TA-65 rescues short telomeres in a telomerase-dependent manner.
A. Scheme of mouse crosses. B. Telomerase activity was measured in MEFs extracts grown in the presence or absence of TA-65 for 24h and 5 days. Two different concentrations of TA-65 were tested. A cellular extract from HCT116 cells was included as a positive control, and RNase was added in all experimental settings as negative control. IC, PCR efficiency control. C. Fold changes in telomerase activity were quantified from the TRAP experiments, comparing to the values obtained for the control situation (without TA-65). At least 4 independent experiments were used per condition. The mean amounts of telomerase activity and error bars (standard deviation) in the different experimental settings are shown. One-way ANOVA was used for statistical analysis. D, E. Telomere fluorescence determined by Q-FISH on MEFs from the indicated genotypes grown in different concentrations of TA-65. Histograms represent the frequency of telomere fluorescence in Kb per telomere dot from a total of 50 nuclei, representing at least 650 telomeric dots per genotype. The red line indicates telomeres presenting <20 Kb of size. F, G. Comparison of the percentage of “signal-free” ends and short telomeres (< 8Kb) between MEFs of different genotypes, growth in the presence or absence of TA-65. Student’s t-test was used for statistical comparisons. H. Comparison of the percentage of “signal-free” ends and short telomeres (< 8Kb) between MEFs of different genotypes. Student’s t-test was used for statistical comparisons. I. Mean γ-H2AX immunofluorescence (green) per nucleus of MEF of the indicated genotype, in the presence or absence of 5 days incubation with TA-65 (DAPI in blue; at least 200 nucleus were scored per condition). Quantitative image analysis was performed using the Definiens Developer Cell software (version XD 1.2; Definiens AG). J. Representative immuno images showing the γ-H2AX (green) and nucleus stainings (DAPI - Blue), in the indicated genotypes.


