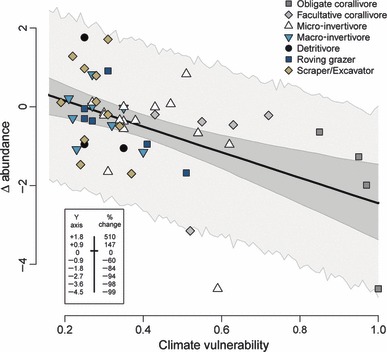
Figure 2.

Assessing the climate vulnerability index through a major disturbance event. Predicted climate change vulnerability scores and fish species population change in the inner Seychelles through the 1998 bleaching event. Trend line represents a Bayesian normal linear-model fit, with the posterior 95% credible and predictive intervals represented as dark and light grey shading respectively.
